2022
Low reflection loss dispersion compensation scheme for broadly tunable sub-ps solid state lasers — Broadly tunable sub-ps solid state lasers are of our special interest since their spectral bandwidth matches well with that of molecular vibrations that can be utilized for CARS or SRS imaging. These lasers are also well suited for fiber delivery due to their moderate spectral bandwidth of 1-2 nm (see e.g. our Yearbook Report in 2020). This year we experimentally demonstrated that combination of high (R>99.9%) reflection from an ion-beam sputtered (IBS) ultrabroadband chirped mirror (UBCM) and Fresnel reflection from a wedged fused silica substrate forming a Gires-Tournois interferometer (GTI) provides a wavelength independent, adjustable dispersion compensation for broadly tunable sub-ps lasers such as Ti:sapphire. For our experiments, support fine mechanics for an IBS UBCM and a rectangular, slightly wedged fused silica substrate was designed. Separation between the highly reflective surface of the UBCM and the uncoated surface of the fused silica wedge is controlled by 3 piezo actuators. Travel distance of this piezo actuator is ~15 μm for a piezo control voltage of 150 V. The outer, wedged surface of the fused silica substrate is antireflection coated for the whole tuning range of Ti:sapphire lasers in order to minimize intra-cavity losses. Fresnel reflection at the air - fused silica interface results in a ~ 4%, wavelength independent reflection acting as the partial reflector of the GTI, while our ion-beam sputtered ultrabroadband chirped mirror is a nearly ideal high reflector providing a wavelength independent high reflectance of R>99.9% over the wavelength range of interest. Computed group delay dispersion (GDD) vs. wavelength function corresponding to a GTI with physical mirror spacing of 15 µm is plotted in Figure 1(a). We can see that free spectral range of the GTI is ~20 nm in this case, which requires fine tuning of mirror spacing in order to provide negative dispersion at a certain operation wavelength. Using our piezo controller, we can set this value in the ~15 µm to ~30 µm range, which allows us doubling the negative dispersion of the GTI structure. We tested our IBS UBCM coated GTI structure in a broadly tunable Ti:sapphire laser, which comprises a PL = 4 mm thick, highly doped Ti:sapphire crystal. Double reflection from the GTI structure allowed us to generate sub-ps optical pulses at our selected wavelengths of 800 nm, 920 nm and 1000 nm. For our pulse duration measurements (see Fig 1(b)), piezo control voltages were respectively set for the measured SHG signal maxima (see Fig. 1(c)), which SHG signal was generated in a properly oriented, 20 micron thick BBO crystal.
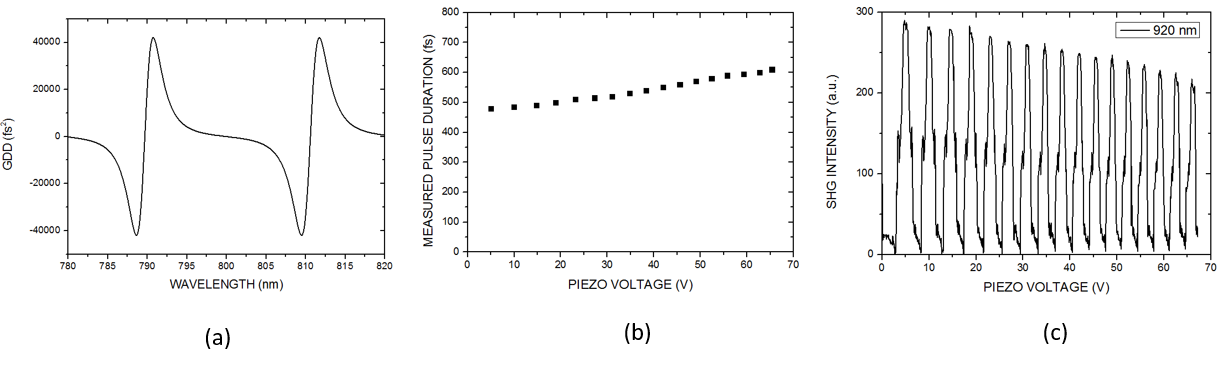
Figure 1. (a) Computed GDD of our GTI with a mirror spacing of 15 µm. (b) Measured pulse duration vs. piezo control voltage of GTI at 920 nm. (c) Measured SHG signal vs. piezo control voltage of GTI. For recording of pulse duration data shown in Fig. 1(b), piezo control voltages were respectively set to SHG signal maxima shown in Fig. 1(c).
Low concentration Phloxine B staining for high chemical contrast, nonlinear microscope mosaic imaging of skin alterations in Pseudoxanthoma Elasticum. —We demonstarted that application of a low concentration Phloxine B staining after the deparaffinization process of PXE sections creates an imaging contrast for elastin and calcification, which enables spectral decomposition of their fluorescence images [1]. The obtained concentration maps for calcium deposits can be well suited for determination of illness severity by quantitative analysis.
FLIM microscopy for quantitative analysis of healthy and tumor regions in rat brain. — Most cancer cells rely on glycolysis rather than on oxidative phosphorylation for glucose metabolism— a shift now commonly referred to as the “Warburg effect.” After glucose is broken down to pyruvate, tumor cells preferentially produce lactate with or without oxygen, even though normal cells undergo oxidative phosphorylation in the presence of oxygen or produce lactate when no oxygen is present. Cancer cells have been reported to upregulate glycolysis in response to changing oxygen availability and requirements in their environment. Skala et al. observed a shift toward upregulated glycolysis in hamster cheek pouch epithelial cells by reporting a shortening of NADH fluorescence lifetime and increased amount of free NADH as cells became more neoplastic. This year we set up and tested our FLIM microscope for NADH detection using rat brain neoplastic tumor samples. Decay time of NADH fluorescence is detected by our new SPC-150 time-correlated single photon counting (TCSPC) electronics from Becker&Hickl GmbH (B&H). TCSPC data is evaluated by an SPCImage software (B&H), which can be used to fit a bi-exponential decay curve, accounting for the different rates of short decay time, free (t1) and amount of free NADH (a1%), and longer decay time of bound NADH (t2) and amount of bound NADH (a2%). Mean lifetime (tmean) can be calculated as the sum of the products of amount of free NADH with free lifetime and amount of bound NADH with bound lifetime.
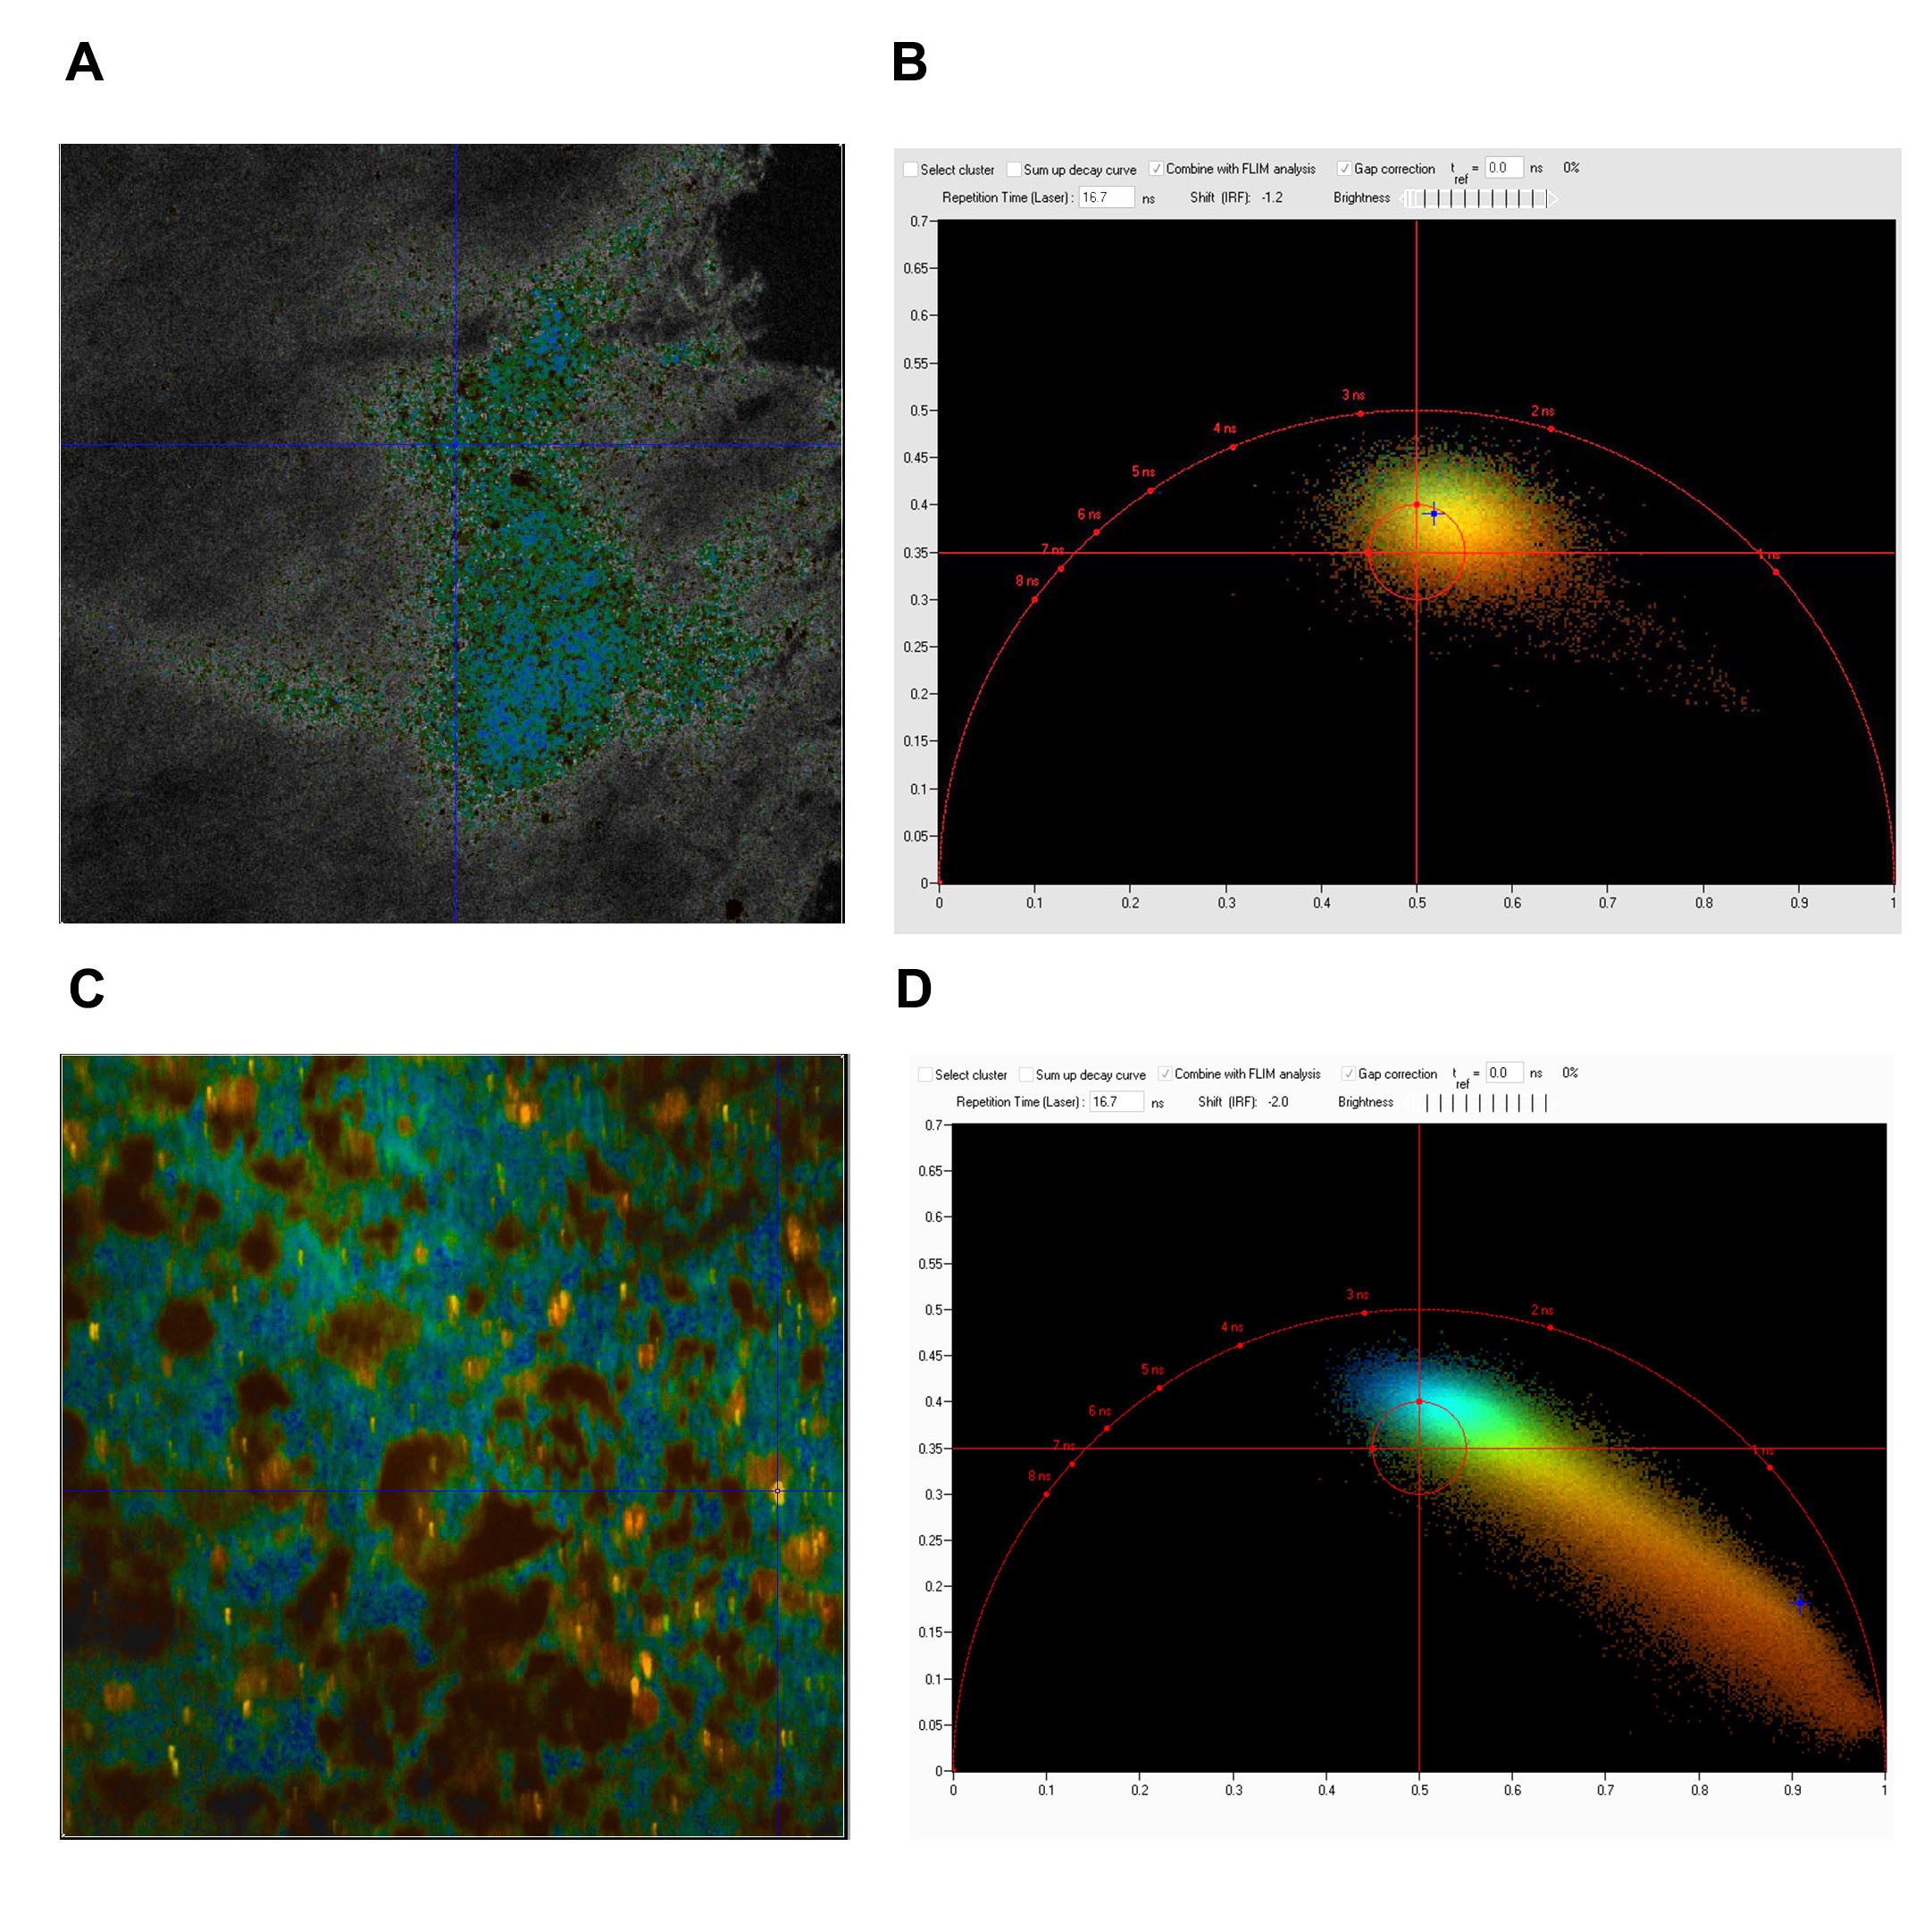
Figure 2. Change in mean lifetime of NADH in normal condition (A) characteristic with oxidative phosphorylation and neoplastic area (C) typical with glycolysis. Normal tissue on phasor plot (B) is represented by high NADH lifetime (2-3 ns) identifying healthy brain cells (colored green and blue in Fig. (A)), which shows that majority of cells belong to the category where NADH exists in bound form. In contrast, tumor tissue exhibits a specific tail on phasor plot (D) showing a transition zone between 0,2 – 2 ns range, which suggests that a high rate of NADH is in free form.