2023
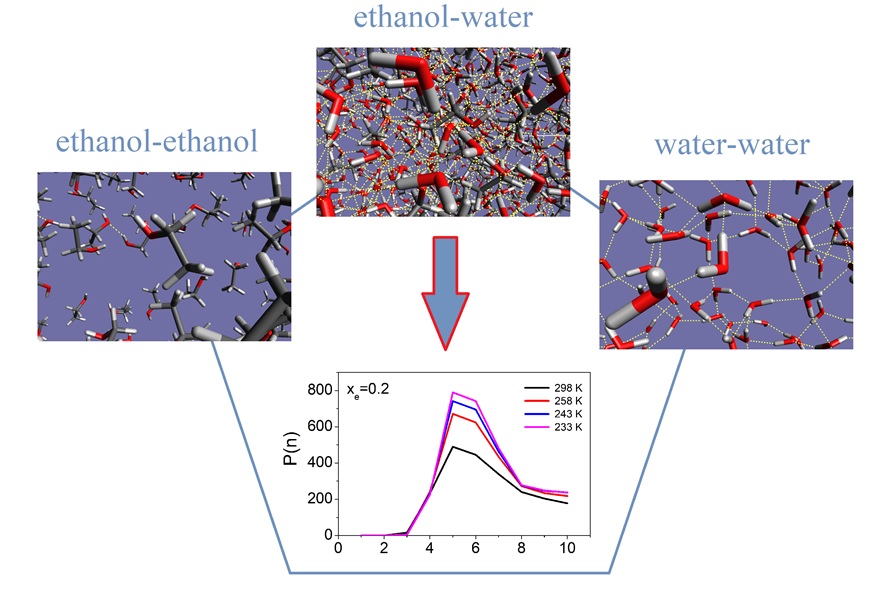
Connecting diffraction experiments diffraction experiment and network analysis tools: a general scheme for the study of hydrogen bonded networks. — A self-consistent scheme has been devised [1] that is applicable for revealing details of the microscopic structure of hydrogen-bonded liquids, including the description of the hydrogen-bonded network. The scheme starts with diffraction measurements, followed by molecular dynamics simulations. Computational results are compared with the experimentally accessible information on the structure, that is most frequently the total scattering structure factor. In the case of an at least semi-quantitative agreement between experiment and simulation, sets of particle coordinates from the latter may be exploited for revealing non-measurable structural details. Calculations of some properties concerning the hydrogen-bonded network have also been described, in the order of increasing complexity: starting with the definition of a hydrogen bond, first and second neighborhoods are described via spatial correlation functions. Attention is then turned to cyclic and non-cyclic hydrogen bonded clusters, before cluster size distributions and percolation are discussed. We would like to point out that, as a result of applying the novel protocol, these latter, rather abstract, quantities become consistent with diffraction data: it may thus be argued that the approach reviewed here is the first one that establishes a direct link between diffraction measurements and elements of network theories. Applications for liquid water, simple alcohols and alcohol-water liquid mixtures demonstrate the usefulness of the aforementioned characteristics [1]. The procedure can readily be applied to more complicated hydrogen bonded networks, like mixtures of polyols (diols, triols, sugars, etc…) and water, and complex aqueous solutions of even larger molecules (even of proteins).
On the Temperature- and Composition-Dependent Structure of Methanol/Water liquid mixtures. – The hydrogen-bonded structure of methanol – water mixtures has been investigated over the entire alcohol concentration range (from xMethanol = 0.1 to 1.0) at several temperatures, from 300 K down to the freezing point of the given mixture [2]. Classical molecular dynamics simulations have been carried out, using the all-atom OPLS-AA force field for methanol and the TIP4P/2005 model for water molecules. Simulation trajectories (‘particle configurations’) obtained have been analyzed, in order to characterize the hydrogen-bonded network in the mixtures. The temperature and concentration dependence of the average hydrogen bond numbers between different types of molecules, the donor/acceptor roles of water and methanol molecules, and hydrogen bond number distributions have been revealed.

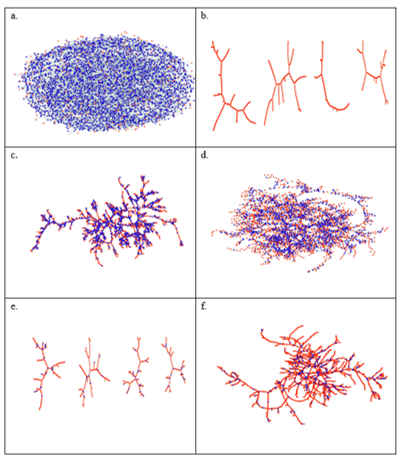
Figure 1. Typical H-bond topology of (a, b) pure methanol (a) at T = 300 K, and (b) at T = 163 K, and (c, d) of the water – subsystem in the methanol – water mixture of xM = 0.54 (c) at T = 300 K, and (d) T = 268 K. Blue dots: molecules; black lines: H-bonds; red thick lines: H-bonds belong to the largest cluster.
The topology of the total system, as well as that of the water and methanol subsystems, has been investigated by calculating the cluster size distributions, the number of primitive rings, and ring size and ring type distributions. The wide variation of cluster topologies may be followed in Figure 1. It has been found that upon cooling, the average number of H-bonded water molecules increases at every concentration and temperature investigated. As far as the connectivity of the hydrogen-bonded network is concerned, the percolation threshold has been shown to be above xM= 0.9 already at room temperature.
Short and medium range order of glassy KSb5S8. — Glassy KSb5S8 was studied [3] by a number of experimental techniques and theoretical methods. In particular, the investigation included X-ray and neutron diffraction techniques, EXAFS and reverse Monte Carlo simulation, as well as DFT studies of clusters of various sizes. Various models of the glassy structure were analysed and compared with crystalline KSb5S8. It was found that Sb atoms in the vitreous state are mostly threefold coordinated by S atoms with a significant contribution of higher coordination. The percentage of corner and edge sharing polyhedra and the distribution of bridging S atoms around Sb is similar in the crystalline and glassy states. DFT studies were used to explore a large number of clusters representative of neat Sb2S3 and KSb5S8, in an effort to illuminate the role of K2S in the Sb2S3 glass and account for the spectral features observed in Raman spectra. The main finding is that the addition of K2S does not cause the typical modification observed in oxide glasses upon alkali oxide addition. The presence of K2S seems to favor hypervalent bonding exemplified by the signature of quasi-tetrahedral units in Raman spectra.

Figure 2. FT-Raman spectra of glassy Sb2S3 and KSb5S8 (left). The spectra have been normalized to the maximum band intensity for better comparison. Schematic illustration of the bridge breaking due to K2S addition in Sb2S3 (right).
References:
[1] Bakó, I.; Pothoczki, S.; Pusztai L.; Connecting Diffraction Experiments and Network Analysis Tools for the Study of Hydrogen-Bonded Networks, The Journal of Physical Chemistry B 127, 2023, 3109-3118; https://doi.org/10.1021/acs.jpcb.2c07740
[2] Pethes, I; Pusztai, L; Temleitner, L; Evolution of the hydrogen-bonded network in methanol-water mixtures upon cooling; J. Mol. Liquids 386, 2023, 122494; https://doi.org/10.1016/j.molliq.2023.122494
[3] Jóvári, P; Chrissanthopoulos, A; Andrikopoulos, KS; Pethes, I; Kaban, I; Kohara, S; Beuneu, B; Yannopoulos, SN; Short range order of glassy KSb5S8 by diffraction, EXAFS, vibrational spectroscopy and DFT calculations; J. Non-Cryst. Solids 616, 2023, 122461; https://doi.org/10.1016/j.jnoncrysol.2023.122461

