2023
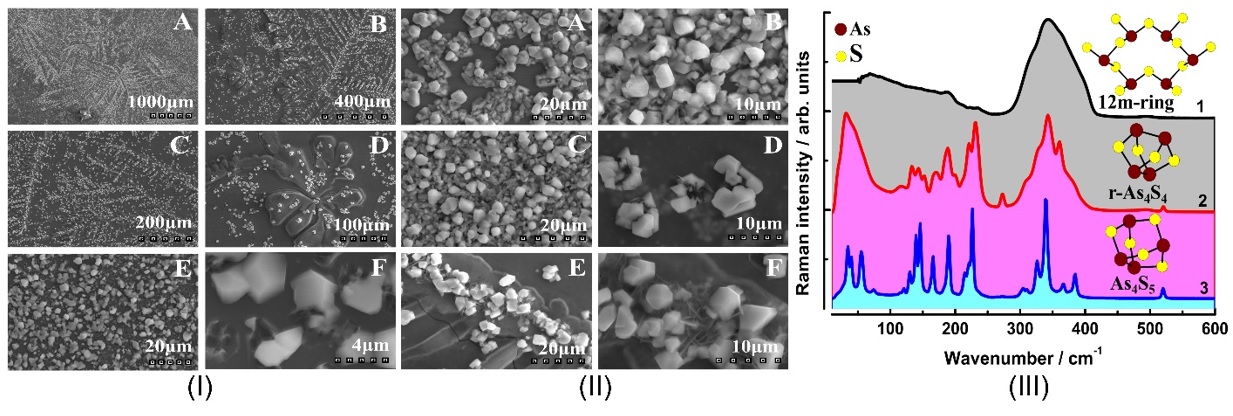
Relation between nanocluster approximation and Soft-Potential Model, the role of keystone nanocluster in the thermal conductivity. — A plateau characterizes the thermal conductivity k(T) of many amorphous materials at temperatures above 1 K together with a maximum in specific heat Cp, called the Boson peak at the same temperature region [1]. It has been believed for over 50 years that those features are the universal property of glasses. Using the analogy of the keystone species concept of ecology, where one species has a disproportionately large effect on its environment relative to its abundance, we presented the impact of keystone nanocluster concentration on low-temperature k(T) [2,3]. Our study is focused on the As-S glassy systems, where each compound represents a different environment. It is shown that the presence of keystone S8 nanoclusters leads to the plateau formation in the k(T) of As2S3 and As2S5 samples. At the same time, the Boson peak in the Cp was preserved, suggesting that nanoclusters contribute to both the k(T) plateau and Cp maximum.
Different types of nanoclusters have been previously identified in As-S systems. Each nanocluster can be considered as a separate entity or species. Inspired by the concept of keystone species from ecology, we decided to examine the impact of individual nanoclusters on the low-temperature properties of glasses. The presence of a keystone species is important for maintaining the character of the environment, and without a keystone species presence, the ecosystem would collapse. Combined analysis using two approaches, the Soft-Potential Model and nanocluster approximation, allowed us to identify the exact structure of nanoclusters in a rigid glass matrix responsible for the mentioned universality (Figure 1). The results of this approach are consistent with the experimental data for the case of As-S glasses, and the possible implementation on other glass systems needs to be verified [2,3].
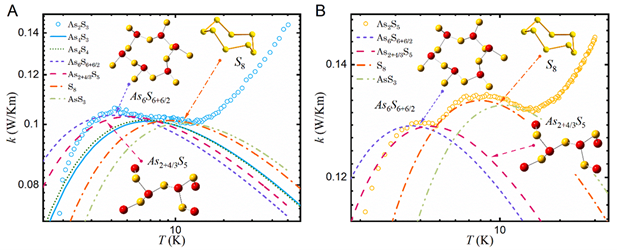
Figure 1. Temperature dependence of thermal conductivity. (A) As2S3, (B) As2S5 glassy samples. The lines represent an individual contribution from different types of nanoclusters calculated from Soft-Potential Model.
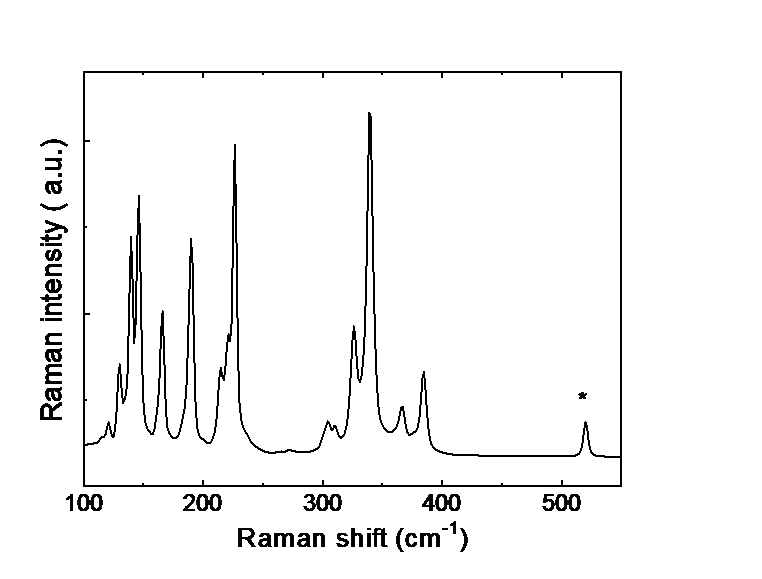
Raman scattering evidence on the correlation of middle range order and structural self-organization of As-S-Ge glasses in the intermediate phase region. — The Raman scattering of bulk nonstoichiometric chalcogenide alloys along the pseudo-binary AsS3 – GeS4 tie-line, which completely lies in the intermediate phase (IP) region of As-S-Ge ternary system was investigated in order to reveal the structural transformations in charge of the unusual features of the middle range order, elastic and physical-chemical parameters of these glasses observed earlier [4]. Inside the intermediate phase region chalcogenide glasses, including the As-S-Ge ternary system can form very narrow compositional areas with high level of structural self-organization, mainly due to sudden increase of the concentration of high flexible species (Figure 2).
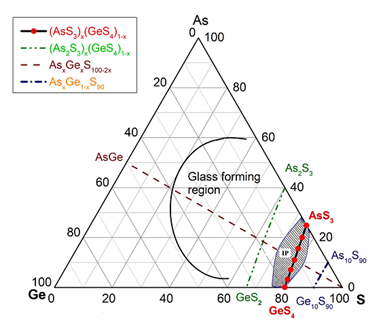
Figure 2. Synthetized AsS3 - GeS4 glasses marked by red filled circles. Solid line and hashed area show the glass forming and intermediate phase regions [5] in As-S-Ge system respectively.
Raman scattering measurements were performed to reveal such a compositional area around the composition of Ge7.7As15.3S77 (x = 0.33; <r> = 2.31) of the pseudo-binary (GeS4)x(AsS3)1-x ternary system. The glasses around this composition appear to be strongly self-organized with an assessed concentration of QT S=As (S1/2)3 around 30 % of total atomic clusters being the building blocks of the structure. An evident correlation was observed between the compositional dependence of the Raman scattering normalized strengths, glass middle range ordering (MRO) parameters, molar volume and longitudinal elastic modulus. Around the above mentioned composition corresponding to strong self-organized glass the MRO parameters and the molar volume exhibit global minima, meanwhile the elastic modulus reaches its maximum value [5].
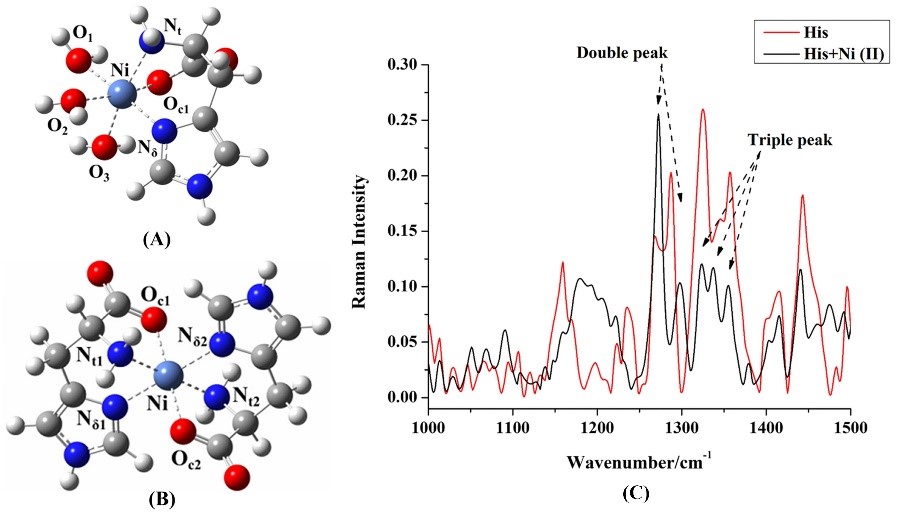
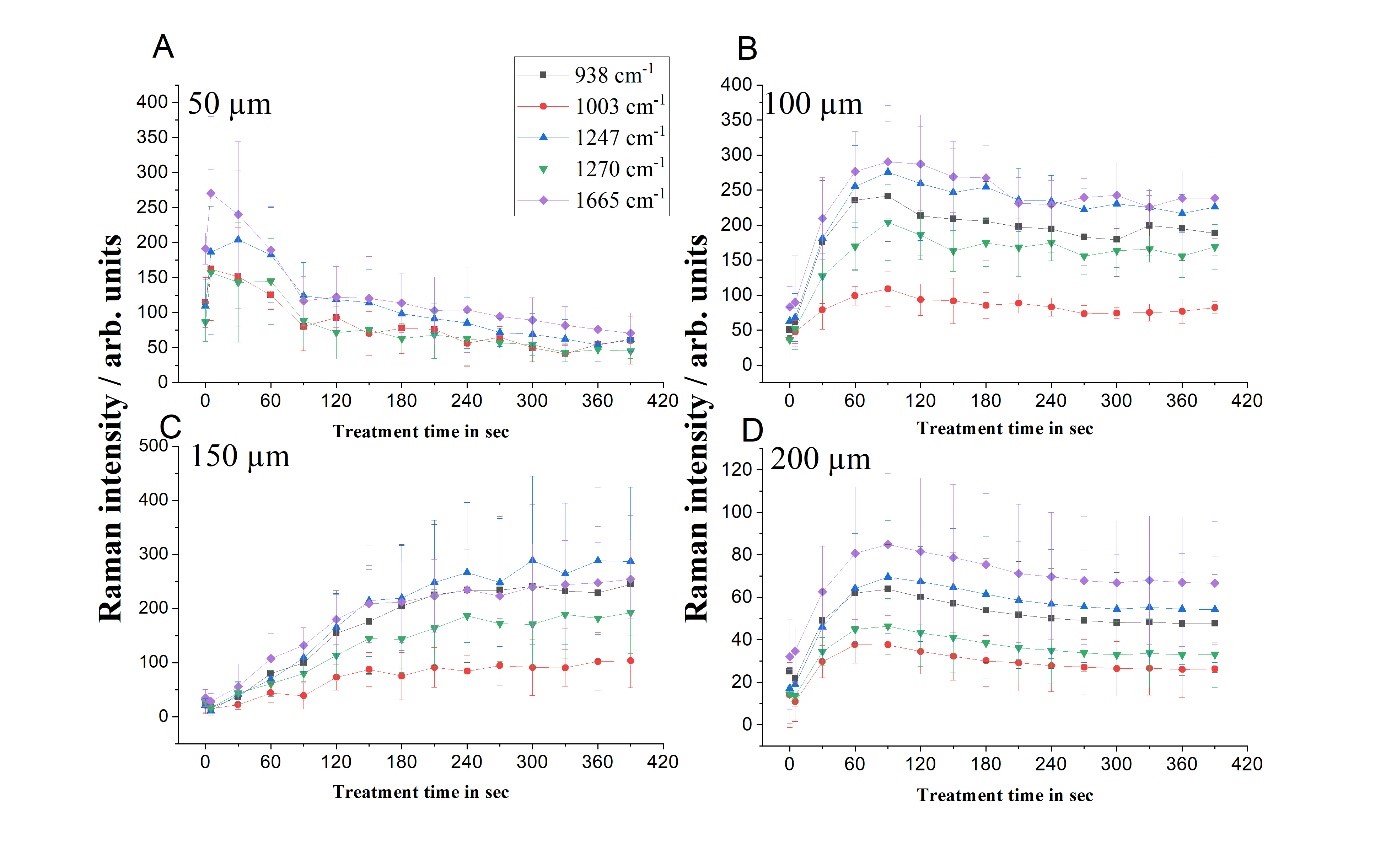
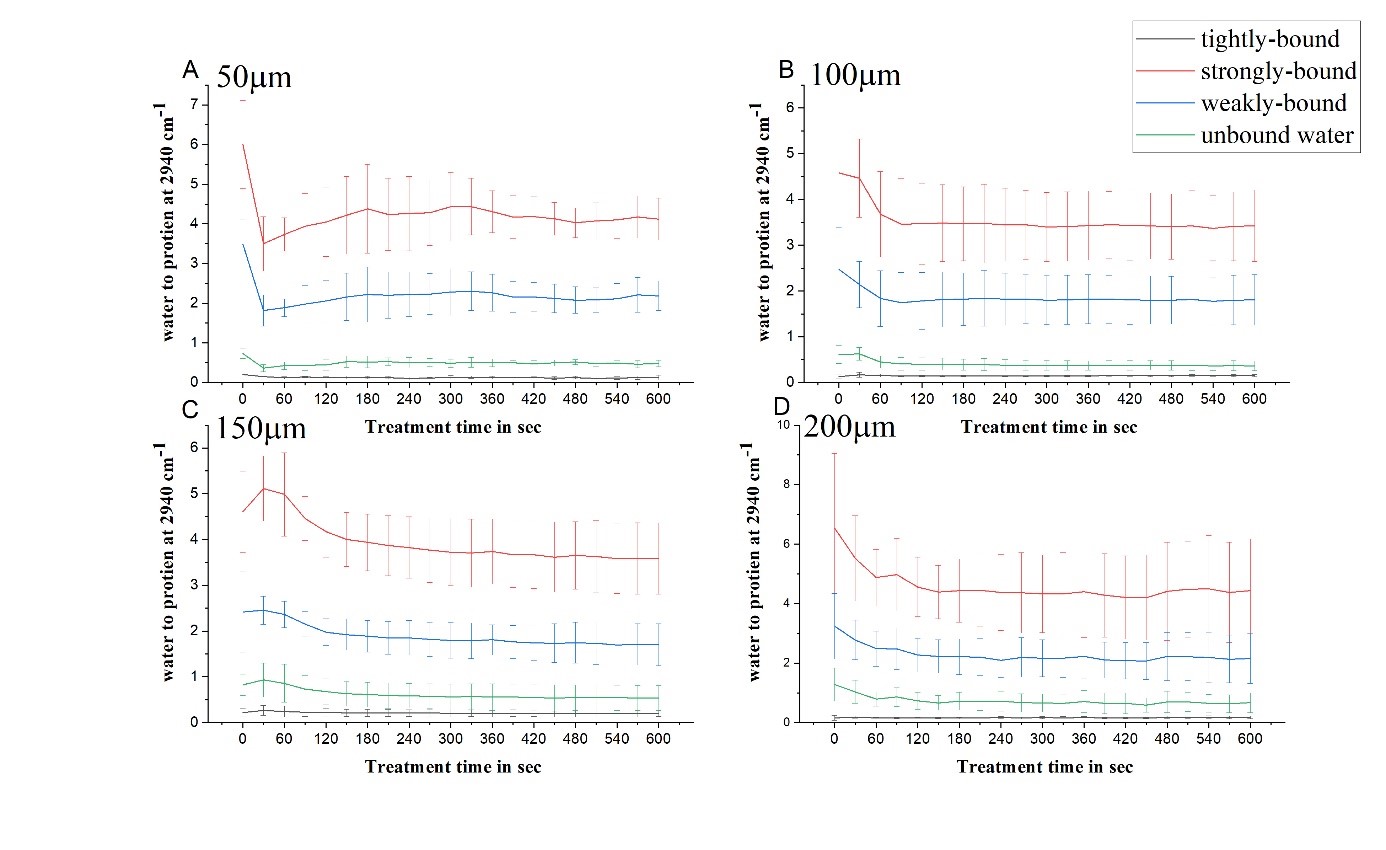
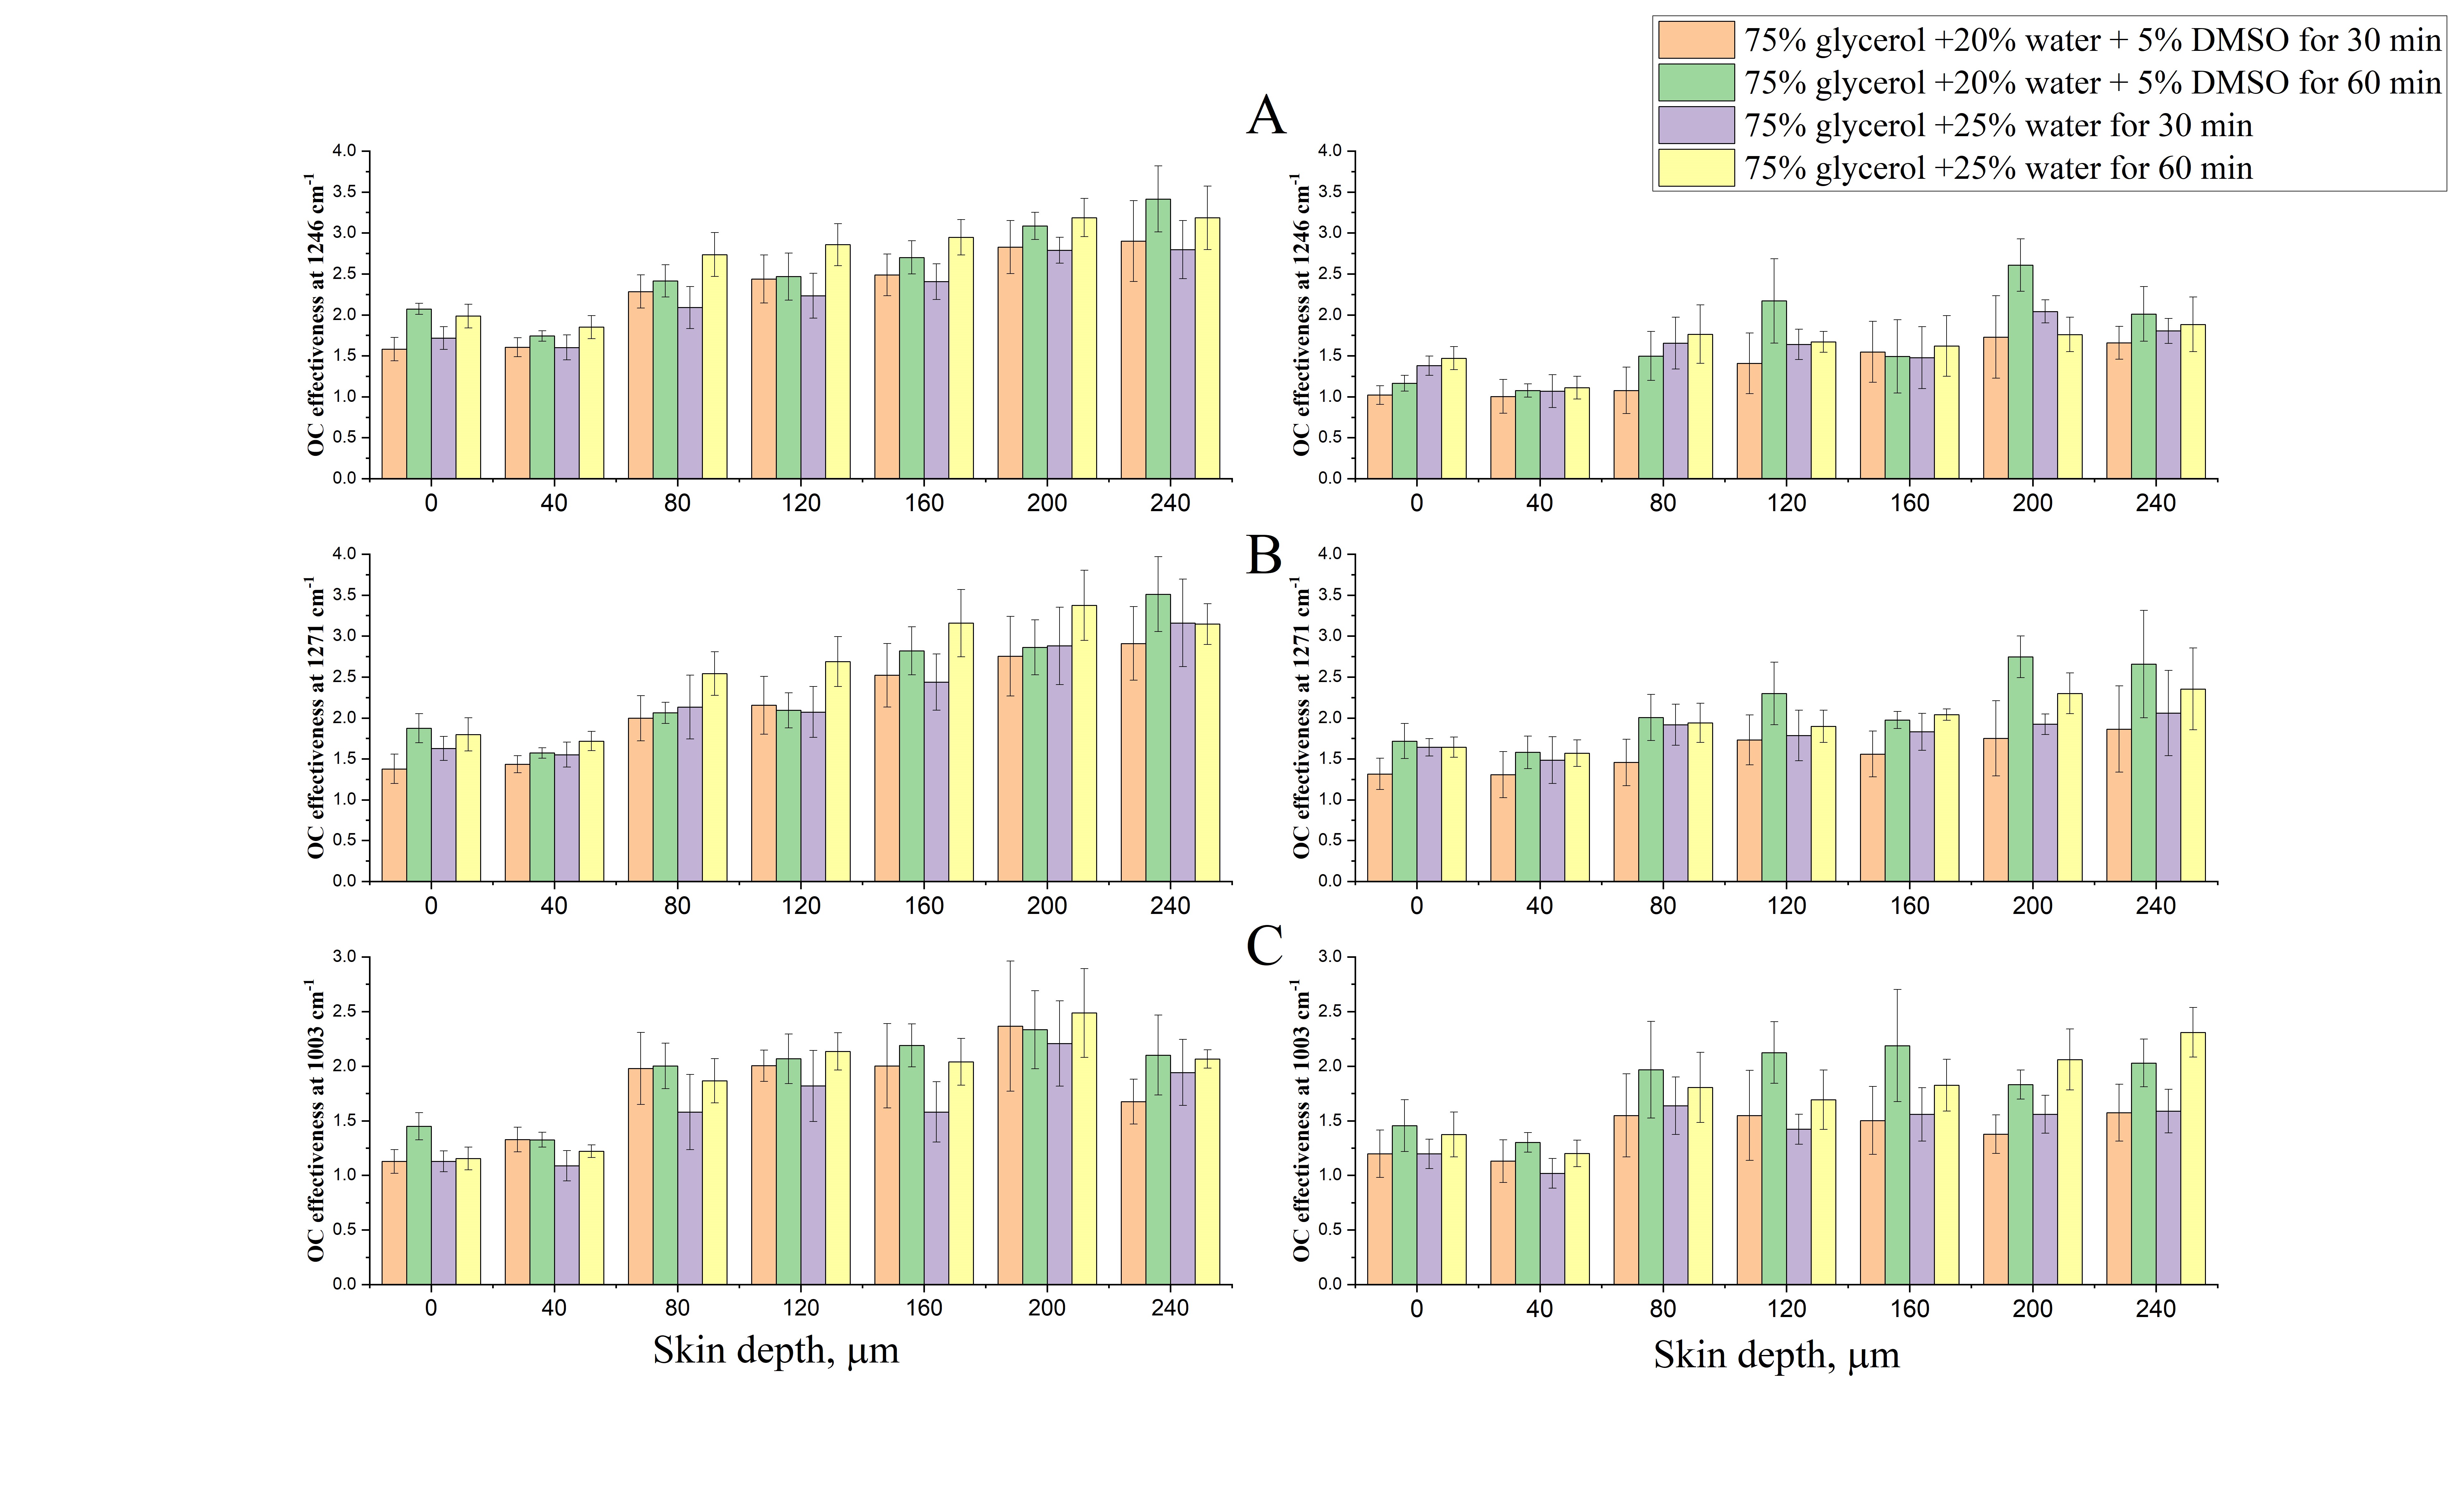
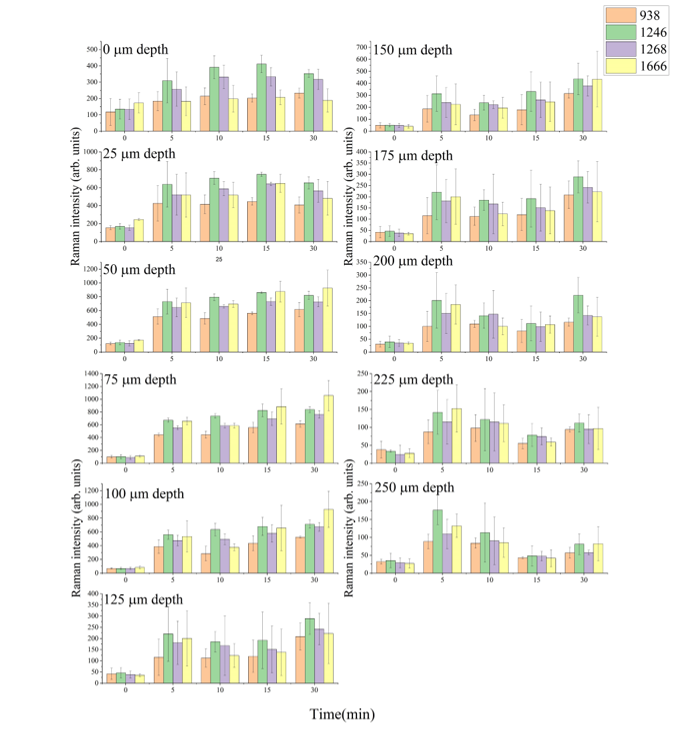
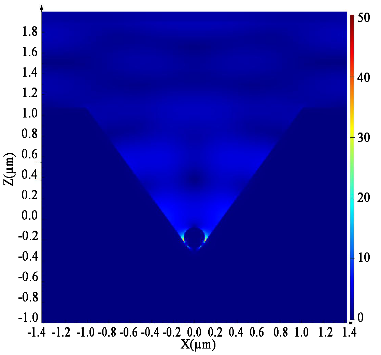
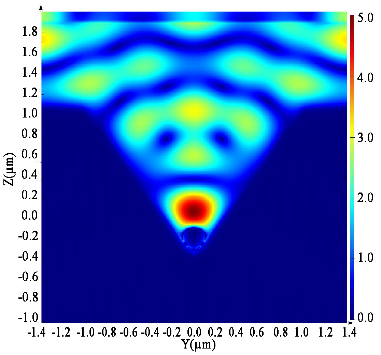
Impact of e-cigarette liquid on porcine lung tissue. — An ex vivo confocal Raman micro-spectroscopy study. — Ex vivo porcine lung immersed in e-liquid was examined using confocal Raman micro-spectroscopy in-depth to evaluate the influence of e-liquid on lung tissue. It was observed that the intensity of lung-related Raman peaks improved after immersed in e-liquid (see Figure 3), which was attributed to the well-known optical clearing effect of glycerol and propylene glycol. Moreover, collagen dehydration was showed by the ratio change of Raman peak intensity (I937/I926) due to influence of the glycerol. We hypothesize that the nicotine free and flavour free e-liquids comprising glycerol and propylene glycol could potentially be employed in clinical protocols as optical clearing agent for improved Raman-guided bronchoscopy in-depth [6].
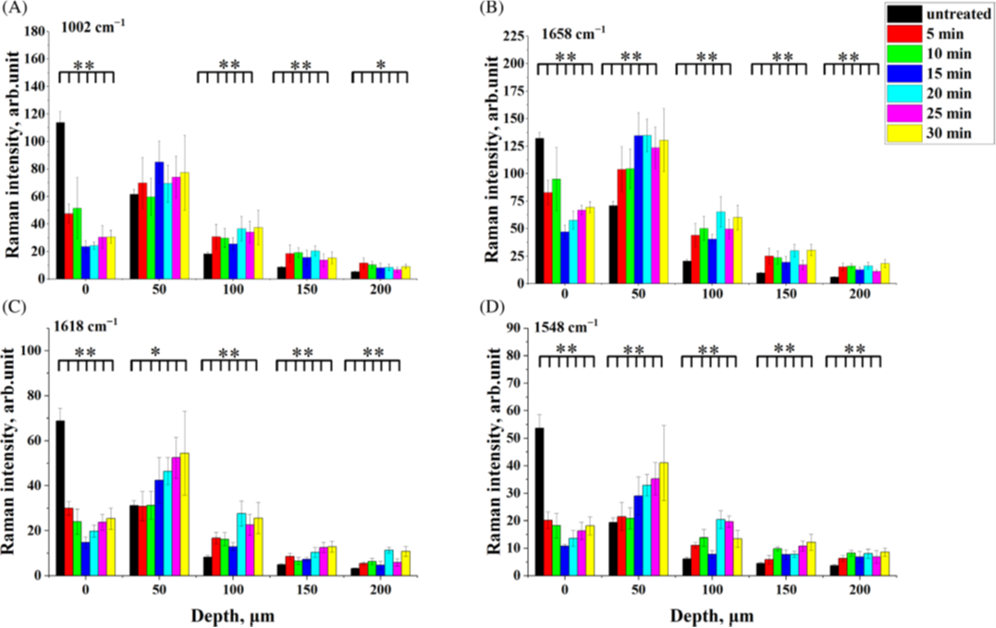
Figure 3. Average intensity of Raman peaks at (A) 1002 cm−1, (B) 1658 cm−1, (C) 1618 cm−1 and (D) 1548 cm−1 of lung tissue control (black), 5 (red), 10 (green), 15 (blue), 20 (cyan), 25 (magenta) and 30 min (yellow) treatment with e-liquid at various depths from 0 to 200 μm.
Effectiveness of Green Synthesized Zinc Oxide Nanoparticles against Extensively Drug-resistant Klebsiella pneumoniae. — Klebsiella pneumoniae (K. pneumoniae) is a pathogenic nosocomial bacterium developed to be a life threatening factor with high intractable infections. The green route of metal oxide nanoparticles could be a promising treatment option. We developed a sustainable technique of green synthesizing ZnO nanoparticles utilizing the pumpkin seed extract with average size around 68 nm. By mixing the green synthesized ZnO nanoparticles (75 mg) with the culture medium, the K. pneumoniae could not grow suggestion that the green synthesized ZnO nanoparticles could be an important factor to combat the K. pneumoniae and reducing chemical base antibiotic dependency [7].
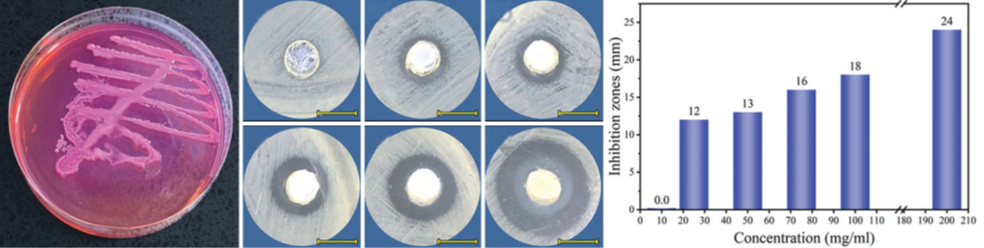
Figure 4. (a) The Klebsiella pneumoniae colony shape, (b g) the antibacterial activity of different concentrations of green synthesized ZnO NPs against K. pneumoniae at 37°C for 1 h, (h) inhibition zone as a function of ZnO NPs concentrations
References:
[1] DOI: https://doi.org/10.1002/pssb.201900525
[2] DOI: https://doi.org/10.1016/j.jnoncrysol.2022.122040
[3] DOI: https://doi.org/10.1063/10.0017815
[4] DOI: https://doi.org/10.1016/j.jnoncrysol.2023.122255
[5] DOI: https://doi.org/10.1002/pssb.202000116
[6] DOI: https://doi.org/10.1002/jbio.202300336
[7] DOI: https://doi.org/10.4103/bbrj.bbrj_167_23