MTA Kiváló Kutatóhely
Hamburget Menu MTA.hu
  • MTA.hu főoldal
  • MTA tudományos hírek
  • MTA pályázatok
  • English
  • Hungarian
Címlap
HUN-REN Wigner Fizikai Kutatóközpont
ELKH ELKH

Main navigation

  • Rólunk
    • Vezetőség és Titkárok
    • Történet
    • Misszió és Évkönyv
    • Kutatóintézeti stratégia
    • MTA Kiváló Kutatóhely
    • Büszkeségeink
    • Közérdekű adatok
    • Alumni
  • Hírek
    • Hírek
    • Intézeti hírek
    • Állások
    • Médiamegjelenések
  • Kutatás
    • Kutatócsoportok
    • Infrastruktúra
    • Nemzeti és kutatólaboratóriumok
    • Nyitott laboratóriumok
    • Futó projektek
  • Oktatás
    • Egyetemi kurzusok
    • OTDK eredmények
    • Szakmai gyakorlat
    • Nyílt napok, diákműhelyek
    • Középiskolásoknak, tanároknak
    • PhD képzés
    • Wigner Kollokvium
  • Kommunikáció
    • Médiatár
    • Brosúrák
    • Letölthető logók
    • Sajtóközlemények
    • Ismeretterjesztés
    • Kutatók éjszakája
    • Könyvkiadás
    • Wigner Café
  • Intranet
  • Kapcsolat

Femtoszekundumos Lézerek a Nemlineáris 3D Mikroszkópiában Kutatócsoport

2023

Combined NAD(P)H and Lipofuscin FLIM reveales the development of metabolic syndrome in the liver of epigenetically altered rats — Low physical performance is closely associated with skeletal muscle dysfunction and metabolic disorders such as obesity, diabetes and cardiovascular disease. The aim of the present study was to characterize the differences in liver mitochondrial function in an aged rat model with congenital low and high running capacity (LCR/HCR) of generation 44. In addition to monitoring basal and succinate-mediated H2O2-induced fluorescence, NAD(P)H and lipofuscin fluorescence lifetime imaging (FLIM) was applied in frozen rat liver tissue. Reduced VO2max, increased muscle wasting and increased body mass were observed in LCR compared to HCR rats. Succinate load suggested a deterioration of intact liver mitochondria in LCR rats: ROS production was greater, accompanied by a limited NADH increase at the same mitochondrial membrane potential. Complex I- and Complex II-driven ADP-coupled ATP production was the same. The NAD(P)H lifetime of cytosol at LCR rats significantly shifted toward free NAD(P)H lifetime values (Gmax= 0,60 ± 0,03) compared to normal young rats (Gmax= 0,54 ± 0,04) indicating a sensitive transition from oxidative phosphorylation to glycolysis (see Fig. 1).  Interestingly, the shift was more pronounced in case of HCR rats (Gmax= 0,69 ± 0,03). 
 

nad


Figure 1. Age shifted metabolism from oxidative phosphorylation toward glycolysis beside elevated formation of lipofuscin that was counterbalanced by intrinsic running capacity (A) and (B) In case of LCR-Old rats, NAD(P)H lifetime of cytosolic areas significantly sifted toward free NAD(P)H lifetime values (Gmax = 0,60 ± 0,03 ) compared to Normal-Young rats (Gmax = 0,54 ± 0,04 ) suggesting switch from oxidative phosphorylation to glycolysis.  Intriguingly, the shift was more pronounced in case of HCR-Old rats (Gmax = 0,69 ± 0,03 ). (A) and (C) Intensity images revealed significant elevation of lipofuscin formation (bright aggregates) of LCR-Old rats comparing to HCR-Old rats and Normal-Young rats suggesting that HCR phenotype is protected partially from oxidative stress. The representative images showed from 4 to 5 animals from each group, and at least 3-4 images were analyzed and at least 10-15 citosolic regions were evaluated statistically. The results showed the means ± SEM (n = 4-5). *P<0.05 LCR-Old compared with the HCR-Old rats; **P<0.05 LCR-Old compared with the Normal-Young group, as determined by analysis of variance (ANOVA), followed by the Tukey HSD test. Bar is 10 μm, applicable to all images


Lipofuscins are pigmented granules with 1–5 μm in diameter and, are believed to be the end-product of lipid peroxidation or oxidative stress and to contain damaged cell membranes that have been phagocytized during the life of the cell.  The endogenous auto-fluorescent pigment, lipofuscin, a by-product of cells exposed to oxidative stress, has a surprisingly bright fluorescence, which allows us to detect and track the evolution of multiple liver pathologies in mouse models and in human tissue. Earlier observations suggest that fluorescence emission in the range of 510 to 700 nm has a bi-exponential decay with lifetimes of t1= 0.4 ns and t2= 1.5 ps to 2.2 ps. These values are extremely close to NAD(P)H lifetime ones. Therefore, we checked our imaging circumstances whether it influences the observed lifetimes of liver aggregates. We used 770 nm 2PF excitation and two emission ranges: #1 460 ± 25 nm specific for NAD(P)H and less specific for Lipofuscin; #2 650 ± 10 nm specific for Lipofuscin and non-specific for NAD(P)H emission to differentiate the two local maximums and specific lifetimes of contributing molecular species.  In case of first emission range (460 ± 25 nm), choosing selective cluster region on 2D phasor plot identified all the aggregates and suggested that the average lifetime of aggregates is tm= 2.2 ± 0.7 ns. However, when we examined at the specific emission range (650 ± 10 nm) we identified two different lifetime values: tm= 0.45 ± 0.2 ns and tm= 0.81 ± 0.3 ps. Interestingly, tm= 0.45 ± 0.2 ns identified big extracellular lipofuscin aggregates, while tm= 0.81 ± 0.3 ns revealed sporadic small aggregates mainly in intracellular locations. In summary, first we identified two different lifetimes at the specific emission range for Lipofuscin and we can also conclude that lifetime examinations at NAD(P)H emission range was not disturbed by Lipofuscin because aggregates area were specifically excluded from research of interests. On the other hand, lifetime changes of lipofuscin could differentiate between necrosis and apoptosis, to study this phenomenon SWIR imaging would offer background to reveal the mentioned valuable physiological information.
 

nad


Figure 2. In the 645 - 655 nm range, where lipofuscin emission is more specific, lifetime cluster selection on the Phasor plot identified lifetimes ~ 0,4 ns and ~ 1,5 ns, which agrees well with data in the literature. For specific Lipofuscin lifetime analysis, it is advisable to use better (e.g. 1030 nm) two-photon excitation wavelength to reveal apoptosis and/or necrosis.


References:
[1] doi: 10.1364/CLEO_AT.2023.JTh2A.121
 

2022

Low reflection loss dispersion compensation scheme for broadly tunable sub-ps solid state lasers  — Broadly tunable sub-ps solid state lasers are of our special interest since their spectral bandwidth matches well with that of molecular vibrations that can be utilized for CARS or SRS imaging. These lasers are also well suited for fiber delivery due to their moderate spectral bandwidth of 1-2 nm (see e.g. our Yearbook Report in 2020). This year we experimentally demonstrated that combination of  high (R>99.9%) reflection from an ion-beam sputtered (IBS) ultrabroadband chirped mirror (UBCM) and Fresnel reflection from a wedged fused silica substrate forming a Gires-Tournois interferometer (GTI) provides a wavelength independent, adjustable dispersion compensation for broadly tunable sub-ps lasers such as Ti:sapphire.  For our experiments, support fine mechanics for an IBS UBCM  and a rectangular, slightly wedged fused silica substrate was designed. Separation between the highly reflective surface of the UBCM and the uncoated surface of the fused silica wedge is controlled by 3 piezo actuators. Travel distance of this piezo actuator is ~15 μm for a piezo control voltage of 150 V. The outer, wedged surface of the fused silica substrate is antireflection coated for the whole tuning range of Ti:sapphire lasers in order to minimize intra-cavity losses. Fresnel reflection at the air - fused silica interface results in a ~ 4%, wavelength independent reflection acting as the partial reflector of the GTI, while our ion-beam sputtered ultrabroadband chirped mirror is a nearly ideal high reflector providing a wavelength independent high reflectance of R>99.9% over the wavelength range of interest. Computed group delay dispersion (GDD) vs. wavelength function corresponding to a GTI with physical mirror spacing of 15 µm is plotted in Figure 1(a). We can see that free spectral range of the GTI is ~20 nm in this case, which requires fine tuning of mirror spacing in order to provide negative dispersion at a certain operation wavelength. Using our piezo controller, we can set this value in the ~15 µm to ~30 µm range, which allows us doubling the negative dispersion of the GTI structure. We tested our IBS UBCM coated GTI structure in a broadly tunable Ti:sapphire laser, which comprises a PL = 4 mm thick, highly doped Ti:sapphire crystal. Double reflection from the GTI structure allowed us to generate sub-ps optical pulses at our selected wavelengths of 800 nm, 920 nm and 1000 nm. For our pulse duration measurements (see Fig 1(b)), piezo control voltages were respectively set for the measured SHG signal maxima (see Fig. 1(c)), which SHG signal was generated in a properly oriented, 20 micron thick BBO crystal.

femtosecond_laser1

Figure 1. (a) Computed GDD of our GTI with a mirror spacing of 15 µm. (b) Measured pulse duration vs. piezo control voltage of GTI at 920 nm. (c) Measured SHG signal vs. piezo control voltage of GTI. For recording of pulse duration data shown in Fig. 1(b), piezo control voltages were respectively set to SHG signal maxima shown in Fig. 1(c).

Low concentration Phloxine B staining for high chemical contrast, nonlinear microscope mosaic imaging of skin alterations in Pseudoxanthoma Elasticum. —We demonstarted that application of a low concentration Phloxine B staining after the deparaffinization process of PXE sections creates an imaging contrast for elastin and calcification, which enables spectral decomposition of their fluorescence images [1]. The obtained concentration maps for calcium deposits can be well suited for determination of illness severity by quantitative analysis.

FLIM microscopy for quantitative analysis of healthy and tumor regions in rat brain. — Most cancer cells rely on glycolysis rather than on oxidative phosphorylation for glucose metabolism— a shift now commonly referred to as the “Warburg effect.” After glucose is broken down to pyruvate, tumor cells preferentially produce lactate with or without oxygen, even though normal cells undergo oxidative phosphorylation in the presence of oxygen or produce lactate when no oxygen is present. Cancer cells have been reported to upregulate glycolysis in response to changing oxygen availability and requirements in their environment. Skala et al. observed a shift toward upregulated glycolysis in hamster cheek pouch epithelial cells by reporting a shortening of NADH fluorescence lifetime and increased amount of free NADH as cells became more neoplastic. This year we set up and tested our FLIM microscope for NADH detection using rat brain neoplastic tumor samples. Decay time of NADH fluorescence is detected by our new SPC-150 time-correlated single photon counting (TCSPC) electronics from Becker&Hickl GmbH (B&H). TCSPC data is evaluated by an SPCImage software (B&H), which can be used to fit a bi-exponential decay curve, accounting for the different rates of short decay time, free (t1) and amount of free NADH (a1%), and longer decay time of bound NADH (t2) and amount of bound NADH (a2%). Mean lifetime (tmean) can be calculated as the sum of the products of amount of free NADH with free lifetime and amount of bound NADH with bound lifetime.

femtosecond laser 2

Figure 2. Change in mean lifetime of NADH in normal condition (A) characteristic with oxidative phosphorylation and neoplastic area (C) typical with glycolysis. Normal tissue on phasor plot (B) is represented by high NADH lifetime (2-3 ns) identifying healthy brain cells (colored green and blue in Fig. (A)), which shows that majority of cells belong to the category where NADH exists in bound form. In contrast, tumor tissue exhibits a specific tail on phasor plot (D) showing a transition zone between 0,2 – 2 ns range, which suggests that a high rate of NADH is in free form.

2021

Numerical analysis on ex vivo second harmonic generation images of collagen structure of unstained basal cell carcinoma sections.  — Nonlinear microscopy, such as two-photon excitation fluorescence microscopy (2PEF), second-harmonic generation (SHG) microscopy and Coherent anti-stokes Raman scattering (CARS) microscopy is increasingly used to perform non-invasive, in vivo studies in life sciences [1]. These techniques enable us to investigate the morphology or monitor the physiological processes (e.g. monitoring drug delivery in the skin) by the use of ultrafast pulse lasers. Fiber (or fiber coupled) lasers are of great interest because they can easily be combined with endoscopy [2]. This latter feature greatly increases the utility of nonlinear microscopy for pre-clinical applications and tissue imaging. Last year we reported on our fiber coupled, ~20 MHz repetition rate, sub-ps Ti:sapphire laser, which is well suited for stain-free, z-stack imaging of fresh and frozen skin biopsies of different skin alterations, such as hemangioma and basal cell carcinoma  (BCC) [2]. In case of hemangioma, that is a benign proliferation of capillaries, we could observe superficial AF signal corresponding to capillaries.  BCC is the most common malignancy in Caucasians. Although BCCs rarely metastasize, local tissue degradation may lead to severe health and cosmetic damage and inoperability.  The gold standard in the therapy of BCC is surgical excision. However, BCCs often have poorly defined borders challenging complete excision. Therefore, there is a demand for efficient imaging techniques for numerical evaluation of the tumor borders of BCC prior to or during surgery. Recently, we carried out fast Fourier-transformation (FFT) analysis on mosaic SHG images from BCC skin sections of different subtypes (nodular, micro-nodular and invasive BCC) [3]. Our aim was to investigate if there are any differences in their collagen structure and to differentiate between subtypes according to the properties of collagen fibers, as well as to determine tumor borders. Our result shows that accuracy of FFT analysis highly depends on the unit cell size parameters (resolution, physical dimension of rectangular image portions) used for FFT (see Fig. 1).

flnm2

Figure 1. Stain-free two-photon mosaic image of  a deparrafinized micro-nodular BCC section (left). Magenta: SHG signal of collagen, orange: TPEF auto-fluorescence signal. Mosaic image size: 4.2 mm (H) x 4.2 mm (V). Individual image size in mosaic image: 420x420 μm2. Heatmaps calculated for different spatial resolution (right). An individual NLM image was divided to A: 2x2, B: 3x3, C: 4x4, D: 5x5 even quadrangles (unit cells) for FFT analysis to determine so called CA ratio maps.


Furthermore, we found that collagen fibers around hair follicles give similar FFT results as fibers around tumor nests, which might hamper exact determination of tumor borders. Combination of FFT analysis with two-photon auto-fluorescence imaging, however, might offer a useful imaging tool for assessment of tumor borders of BCC [3].

Low concentration Phloxine B staining for high chemical contrast, nonlinear microscope mosaic imaging of skin alterations in Pseudoxanthoma Elasticum. [4] —Nonlinear microscopy is well suited for ex vivo histopathological investigations as well on skin sections orthogonal to the skin surface, like in case of Pseudoxanthoma Elasticum (PXE), when the imaging depth of the imaging system is not sufficient or we need a low concentration staining for chemical selectivity [3]. PXE is an autosomal recessive metabolic disorder characterized by ectopic mineralization of soft connective tissue. Mineralization is located by some ~400 microns (or more) below the skin surface, which is roughly twice of our typical imaging depth at around our excitation wavelength of ~800 nm. We have developed a normalized 3D color vector representation of emission spectra of three of the main tissue components (collagen, elastin and calcification) and found that due to their broad, overlapping emission spectra, spectral separation of emission from elastin and calcification is practically impossible in fresh-frozen or unstained, deparaffinized PXE sections. However, we found that application of a low concentration Phloxine B staining after the deparaffinization process creates an imaging contrast for these two tissue components, which enables spectral decomposition of their fluorescence images (see Table 1). The obtained concentration maps for calcium deposits can be well suited for determination of illness severity by quantitative analysis.

flmn1

Table 1.  Sets of color vector coordinates describing signal intensities of collagen, elastin and calcium deposits in PXE cryosections and Phloxine B stained PXE sections.  Detection channels are supplied with bandpass filters 405/20 (magenta), 460/50 (cyan) and 590/45 (orange), respectively. Color highlighting indicates the detection channel in which a given compound emits the highest nonlinear optical (SHG or TPEF) signal. For the Phloxine B stained deparaffinized PXE sections, data is expressed as mean ± standard deviation of measured values.


FLIM upgrade for our LSM 7MP microscope system. — Metabolism of living cells can be investigated by nonlinear microscopy by measuring the so called redox ratio, which can be determined by detection of the auto-fluorescence signals emitted by NADH (nicotinamide adenine dinucleotide) and FAD (nicotinamide adenine dinucleotide). These two endogenous  fluorophores play important role in cell metabolism. Their fluorescence signal, however, strongly depends on imaging conditions that is why we installed and successfully tested a FLIM (fluorescence lifetime imaging) upgrade for our LSM 7MP microscope system. Among others, it can be well suited for identification of cancer cells:  the FLIM signal does not depend on concentration, imaging depth or excitation parameters such as wavelength, pulse duration or power, but very sensitive for the micro-environmental conditions of the cells such as molecular bonds, pH or oxygen concentration, which can offer reference images for our histological images obtained by other nonlinear techniques such as CARS, SHG or 2PEF.


References:
[1] doi: 10.1126/science.aax6752
[2] doi: 10.1364/BODA.2021.DF2A.5
[3] https://www.osapublishing.org/DirectPDFAccess/32F0A34F-C0E3-449E-9FAB68…
[4] doi: 10.1364/BOE.443507

2020

A fiber-coupled, 20 MHz repetition rate, sub-ps Ti:sapphire laser for in vivo nonlinear microscopy of the skin  — Nonlinear microscopy, such as two-photon excitation fluorescence microscopy (2PEF), second-harmonic generation (SHG) microscopy and Coherent anti-stokes Raman scattering (CARS) microscopy is increasingly used to perform non-invasive, in vivo studies in life sciences [1]. These techniques enable us to investigate the morphology or monitor the physiological processes (e.g. monitoring drug delivery) in the skin (or the brain) by the use of ultrafast pulse lasers. Fiber (or fiber coupled) lasers are of great interest because they can easily be combined with endoscopy. This latter feature greatly increases the utility of nonlinear microscopy for pre-clinical applications and tissue imaging. In 2016, we reported on a novel, handheld 2PEF/SHG microscope imaging system comprising a sub-ps Yb-fiber laser system, which was suitable for in vivo imaging of murine skin at an average power level as low as 5 mW at 200 kHz sampling rate. The whole nonlinear microscope imaging system had the main advantages of the low price of the fs laser, fiber optics flexibility, a relatively small, light-weight scanning and detection head, and a very low risk of thermal or photochemical damage of the skin samples. In principle, 2PEF microscopy can visualize endogenous fluorophores, such as elastin, keratin, NADH, FAD, etc., while the morphology of collagen fibers can be assessed by SHG microscopy. Due to the limited photon energy of our Yb-fiber laser system operating at around 1030 nm, however, we could not efficiently excite a few of these endogenous fluorophores (such as elastic fibers, NADH, FAD) with our handheld our 2PEF imaging system. This fact considerably limited its applicability in case of rear skin diseases (such as Ehlers-Danlos syndrome (EDS), pseudoxanthoma elasticum (PXE) [2]) or in case of basal cell carcinoma (BCC), the latter one being the most common malignancy in Caucasians. In order to overcome this problem, we replaced our Yb-fiber laser by a fiber coupled Ti:sapphire laser operating at around 810 nm, whose physical parameters (repetition rate, spectral bandwidth, peak intensity, etc) were optimized for fiber delivery and low thermal load, in vivo imaging of the skin.

The 20 MHz repetition rate, sub-ps Ti:S laser used in our fiber delivery and nonlinear microscope imaging experiment is similar to that we used for real time histology of the skin [3]. For our imaging experiments, we had to make a few modifications relative to our initial setup in order to reduce the spectral bandwidth of the laser. It results in higher chemical selectivity in DVRF-CARS imaging [3] and lower sensitivity of the optical pulses for dispersive effects during fiber delivery.  To this end, we replaced the SF10 prism pair by a piezo controlled Gires-Tournois interferometer (GTI), which provided considerably higher intracavity dispersion than a prism pair. A birefringent filter (BRF) is used for tuning of the laser. Owing to the enlarged intracavity dispersion, spectral bandwidth of the Ti:sapphire laser has been reduced below 2 nm. Accordingly, the pulse duration of the laser increased above 600 fs. This four-fold reduction in the peak intensity was compensated by the lower repetition rate of our long cavity Ti:sapphire laser comprising a Herriott-cell. The laser is pumped by a 2.1 W average power, 532 nm laser. Final setup of the 20 MHz repetition rate, sub-ps Ti:S laser used for fiber delivery and imaging experiment is shown in Fig. 1.

Femtoszekundumos lézerek 1

Figure 1. Setup of the 20 MHz repetition rate sub-ps Ti:sapphire laser used for fiber delivery and nonlinear microscope imaging of the skin. Ti:S: Ti:sapphire crystal (PL= 4mm), BRF: birefringent filter for wavelength tuning, HCM: Herriott-cell mirros, UBCM: ultrabroadband chirped mirrors, GTI: a piezo-controlled Gires-Tournois interferometer, SAM 800: saturable absorber mirror, OC: output coupler.

Pulse duration of the ~20 MHz laser was characterized by a PulseCheck autocorrelator (APE GmbH, DE). Depending on the intracavity dispersion set by the mirror spacing of an intracavity GTI, the pulse duration could be set in the 0.6-1 ps range (see Fig. 2.a, black dots). The Δλ < 2 nm spectral bandwidth of the laser allows distortion free fiber delivery of the optical pulses through a ~1.8 m long HC-800-2 type, commercial hollow core photonic bandgap fiber with honeycomb structure (product of NKT Photonics, Denmark) (see Fig. 2.a, red dots). The mode-locked average power of the laser is ~225 mW, after the fiber decoupling optics it is reduced to ~125 mW.

Femtoszekundumos lézerek 2

Figure 2. (a) Pulse duration of the laser vs. piezo voltage of GTI measured before (black dots) and after (red dots) a 1.8 m hollow core fiber. (b) Tumor border of BCC and (c) hemangioma detected by SHG imaging of collagen and TPEF measurement in the 500-550 nm spectral range. Laser central wavelength: 810 nm.   Average power on sample: ~20 mW. Image size: 420 x 420 µm2. Z-stack imaging range: 0-180 µm.

Fresh and frozen skin biopsies of different skin alterations (hemangioma, BCC and PXE) have been used for testing our fiber-coupled laser for z-stack imaging. In case of BCC, we could detect the border of the tumor highlighted by a strong contrast of AF (cells with basal cell morphology) and SHG (collagen fibers around tumor nest). In case of hemangioma, that is a benign proliferation of capillaries, we could observe superficial AF signal corresponding to capillaries. In case of PXE [2], however, we could not detect calcification, since our imaging depth of ~200 µm was not sufficient to reach the region of calcification, which is typically located in the mid-dermis at least 300 µm below the skin surface.

2019

20 MHz repetition rate, sub-picosecond Ti:sapphire laser for high chemical contrast CARS imaging. — Coherent anti-stokes Raman scattering (CARS) microscopy is widely used in label-free biomedical imaging applications. For in vivo diagnostic use of CARS microscopy, wide field detection is preferred to descanned configurations. Chemical selectivity poses a major difficulty when femtosecond (fs) pulse lasers are applied, as their spectral bandwidth is typically significantly higher (~5-10 nm) than the optimum value (~ 1 nm) matching the bandwidth of molecular vibrations. This fact leads to the appearance of an enhanced non-specific background and the decrease of spectral sensitivity in CARS imaging. Last year we proposed a fast spectral modulation technique for sub-100 fs pulse Ti:S lasers , which allowed us to modulate the laser spectrum on ms time scale with the use of a piezo-driven Michelson interferometer. In one of the settings we used, we modulated the laser spectrum of our laser in such a way, that CARS imaging for CH2 bonds in “lipids” and CH3 bonds “proteins” did not require any tuning of the pump (Ti:S) laser or any readjustment of the delay between the pump and Stokes (Yb-amplifier) pulses, which allowed us to record stain-free histological images of brain slices. This year we have developed a ~20 MHz, sub-ps Ti:sapphire laser system, which supports real time, two-channel, high chemical contrast, DVRF CARS imaging, i.e. histology of the skin by a commercial LSM 7 MP microscope (Carl Zeiss, Jena, DE) without any modification of its ZEN software or post-processing of the images like in case of our previous CARS setups used for histology.

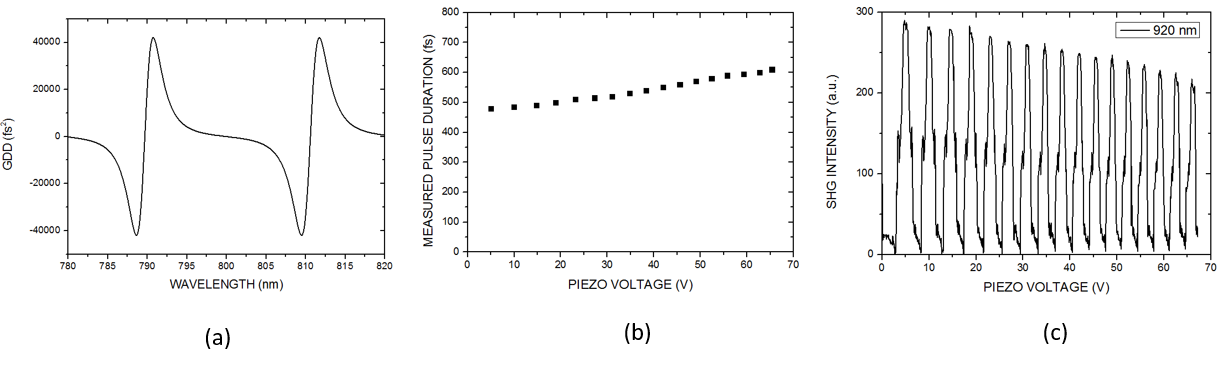
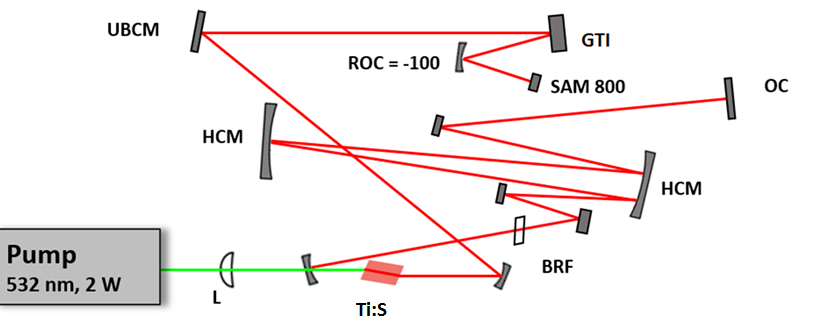
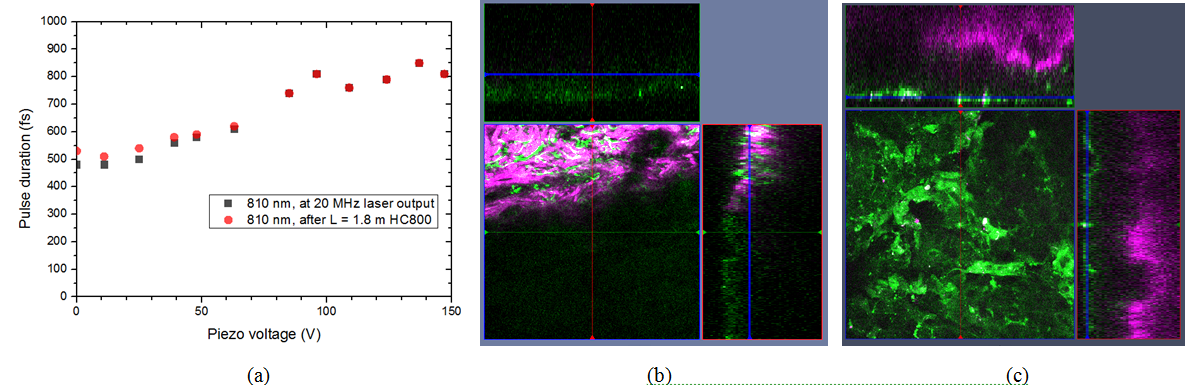
The long cavity laser configuration is similar to that was published in , with a few modifications: 1.) We replaced the SF10 prism pair by a properly designed Gires-Tournois interferometer (GTI, R&D Ultrafast Lasers Ltd.), which provides considerably higher intracavity dispersion than the the prism pair previously used. 2.) Stable mode-locking of the laser is assured by a saturable absorber mirror (SAM, Batop GmbH, DE). 3.) Broad tunability, i.e. the possible use of different SAMs for different molecular vibration regimes is assured by ion-beam sputtered ultrabroadband chirped mirrors (R&D Ultrafast Lasers Ltd). Beside a birefringent tuning element, fine tuning of the Ti:sapphire laser is obtained by the piezo controlled GTI. In our new setup, the spectral bandwidth of the pump (Ti:S) laser has been reduced from 6-8 nm to ~2 nm. Accordingly, the pulse duration has increased  from ~150 fs to ~ 600 fs, or slightly above. This four-fold reduction in the peak intensity is compensated by the lower repetition rate of our long cavity Ti:sapphire laser comprising a Herriott-cell and a ~2W average power, 532 nm pump laser. Pulse duration of the ~20 MHz laser has been characterized by a PulseCheck autocorrelator (APE GmbH, DE). Depending on the intracavity dispersion set by the mirror spacing of an intracavity GTI, the pulse duration can be set in the 0.6-1 ps range.

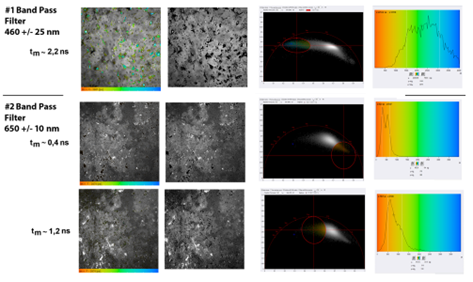
Real time, stain free, high contrast histology of the skin. — The ~20 MHz repetition rate, sub-ps Ti:sapphire (Ti:S) laser introduced in the previous section has been tested for real time, high chemical contrast dual vibration resonance frequency (DVRF) CARS imaging of the skin, which is suitable for in vivo histology. For our comparative studies, we used two different CARS imaging setups, as shown in Fig. 1. In our setup at the University Szeged (USZ), we used a ~80 MHz, ~80 fs Ti:S laser (Mai Tai, Newport Spectra-Physics, USA) as a pump laser (for details, see Refs. and ). In the setup at Wigner RCP, Budapest, we replaced our industrial standard, ~76 MHz, ~150 fs Ti:S laser by our newly developed, ~20 MHz repetition rate, sub-ps Ti:S laser. Spectral bandwidth of the ~20 MHz Ti:sapphire laser (pump) was measuredΔλ < 2 nm allowing high spectral resolution DVRF-CARS imaging. For higher spectral contrast between the anti-Stokes signals generated by „lipids” and „proteins”, we placed a Michelson interferometer similar to that was used in Ref. 1 into the beam path of our Stokes (Yb) laser. By spectral modulation, we obtained a double peaked spectrum with a peak separation of 5-6 nm at around 1030 nm. DVRF CARS imaging was performed by two NDD detectors of our microscope: the anti-Stokes signals for „lipids” and „proteins” were separated by a dichroic mirror with a long pass edge at around 645 nm, while two bandpass filters with central wavelengths at 641 nm and 650 nm were respectively placed in front of the NDD-s. The optical signal detected by the „lipid” detector was pseudo-colored red, while that of the „protein” was given the color blue to match conventional H&E stained histology.

S-L2019_1

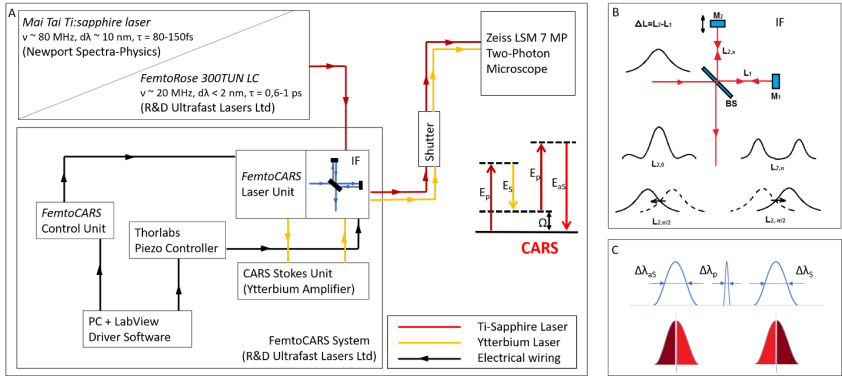
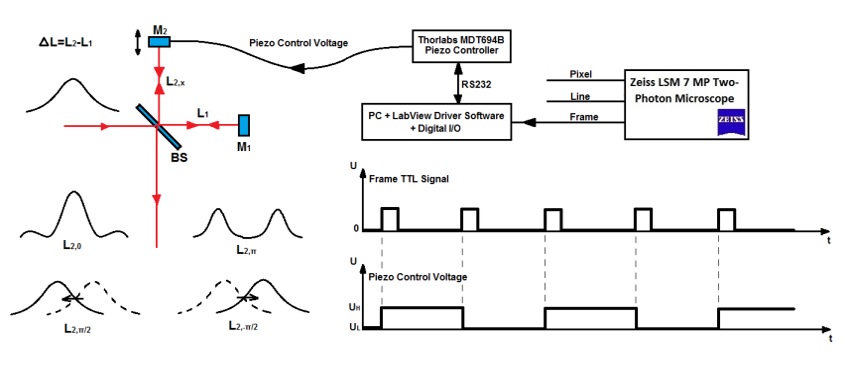
Figure 1. A) Layout of the experimental setups used for IF-CARS and real time DVRF CARS imaging with a 20 MHz, sub-ps Ti:S laser. In both setups, a Michelson-interferometer is used for spectral modulation of either the pump (IF-CARS setup) or Stokes pulses (real time DVRF CARS setup). By electonically modulating the phase difference (Δφ) of the two mirrors, different output spectra can be obtained. B) Phase difference Δφ = 0 at the central frequency results in a narrower spectrum, whereas Δφ = π results in a double-peaked spectrum around the central wavelenght, when the path difference offset, ΔL is properly set. When the phase difference is π/2 or – π/2, two different spectrally shifted laser spectra is obtained with two maxima a few nm-s apart. C) For high chemical contrast, real time DVRF-CARS imaging with two parallel NDD detectors, at least one of the pump or Stokes laser spectral bandwidth has to be small enough (< 2 nm) to create properly distinguishable anti-Stokes signals. If Δλp is small (~2 nm) and ΔλS is broader (~10 nm), nearly half of the Stokes photons (of lower energy) excites the CH2 bonds in lipids, while others (of higher energy) excite the CH3 -bonds in proteins.

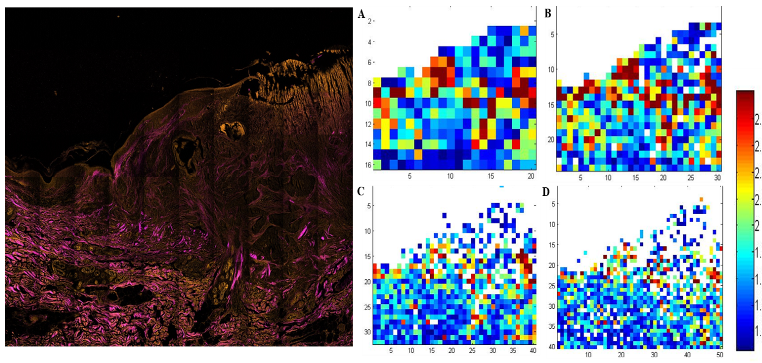
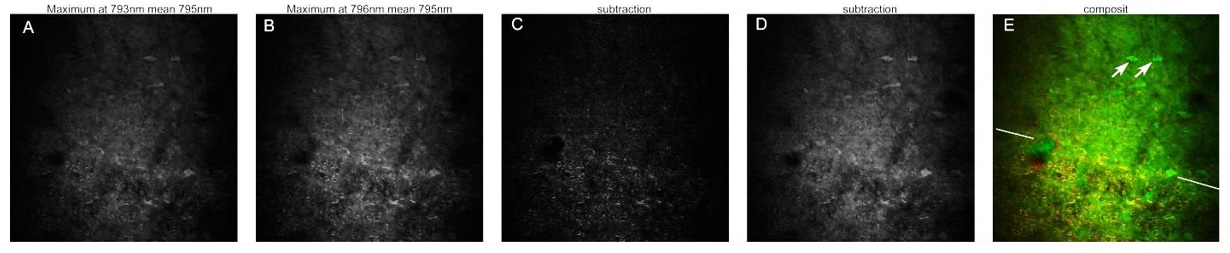
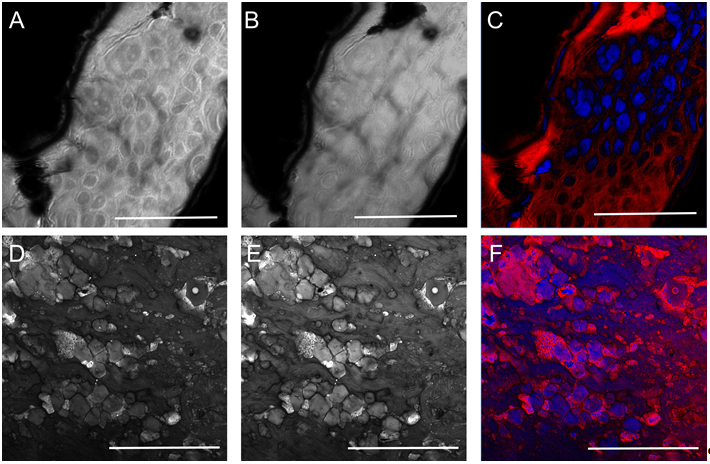
Histological imaging experiments on ex vivo human and murine skin samples by different CARS imaging methods are summarized in Figure2. As a main result, we can say that our new, ~20 MHz, sub-ps Ti:S laser system supports real time, two-channel, high contrast, dual vibration resonance frequency (DVRF) CARS imaging, i.e. histology of the skin by a LSM 7 MP microscope with its original ZEN software, with properly chosen commercial bandpass and dichroic filters in front of the two NDD detectors and without any postprocessing of the images like in case of our previous CARS setups used for histology.

S-L2019-2

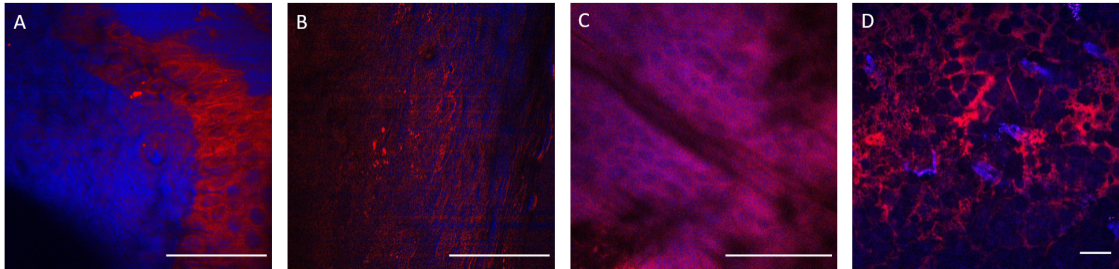
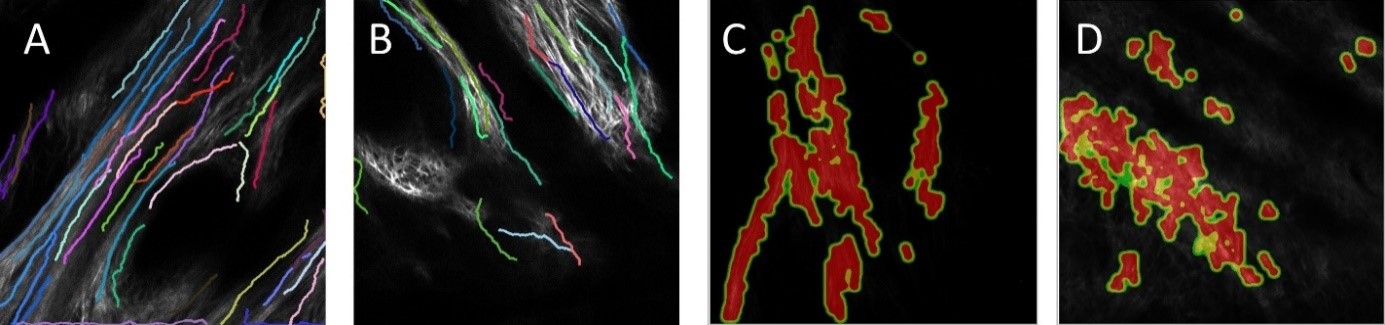
Figure 2. Histological imaging of ex vivo human and murine skin samples by different CARS imaging methods.  A) Composite of CARS images recorded for "proteins" and "lipids" in human basal cell cancer (after post-processing) with a Mai Tai pump laser tuned to 790 and 798 nm, respectively. B) IF-CARS imaging of murine skin (after post-processing) with spectrally modulated Mai Tai pump laser pulses with spectral maxima at 792 and 796 nm. C) Post-processed DVRF-CARS image of murine skin with a Mai Tai pump laser tuned to 796 nm with simultaneous detection of the two anti-Stokes signals. D) Real time DVRF-CARS image of murine skin with simultaneous detection of the lipid („-CH2 vibration” ) and protein ("-CH3 vibration") channels with our ~20 MHz sub-ps Ti:sapphire laser tuned to ~795 nm and with a double-peaked (off resonance, see Fig. 1b ) Yb-laser spectrum. Scalebar on each figure: 50 μm.

This new setup can also be used for in vivo experiments on murine skin or ex vivo analysis on human pathological skin (or brain) samples, which, in longer term, may pave the way for applications during Mohs-surgery or real time in vivo diagnosis of skin lesions or brain tumor.

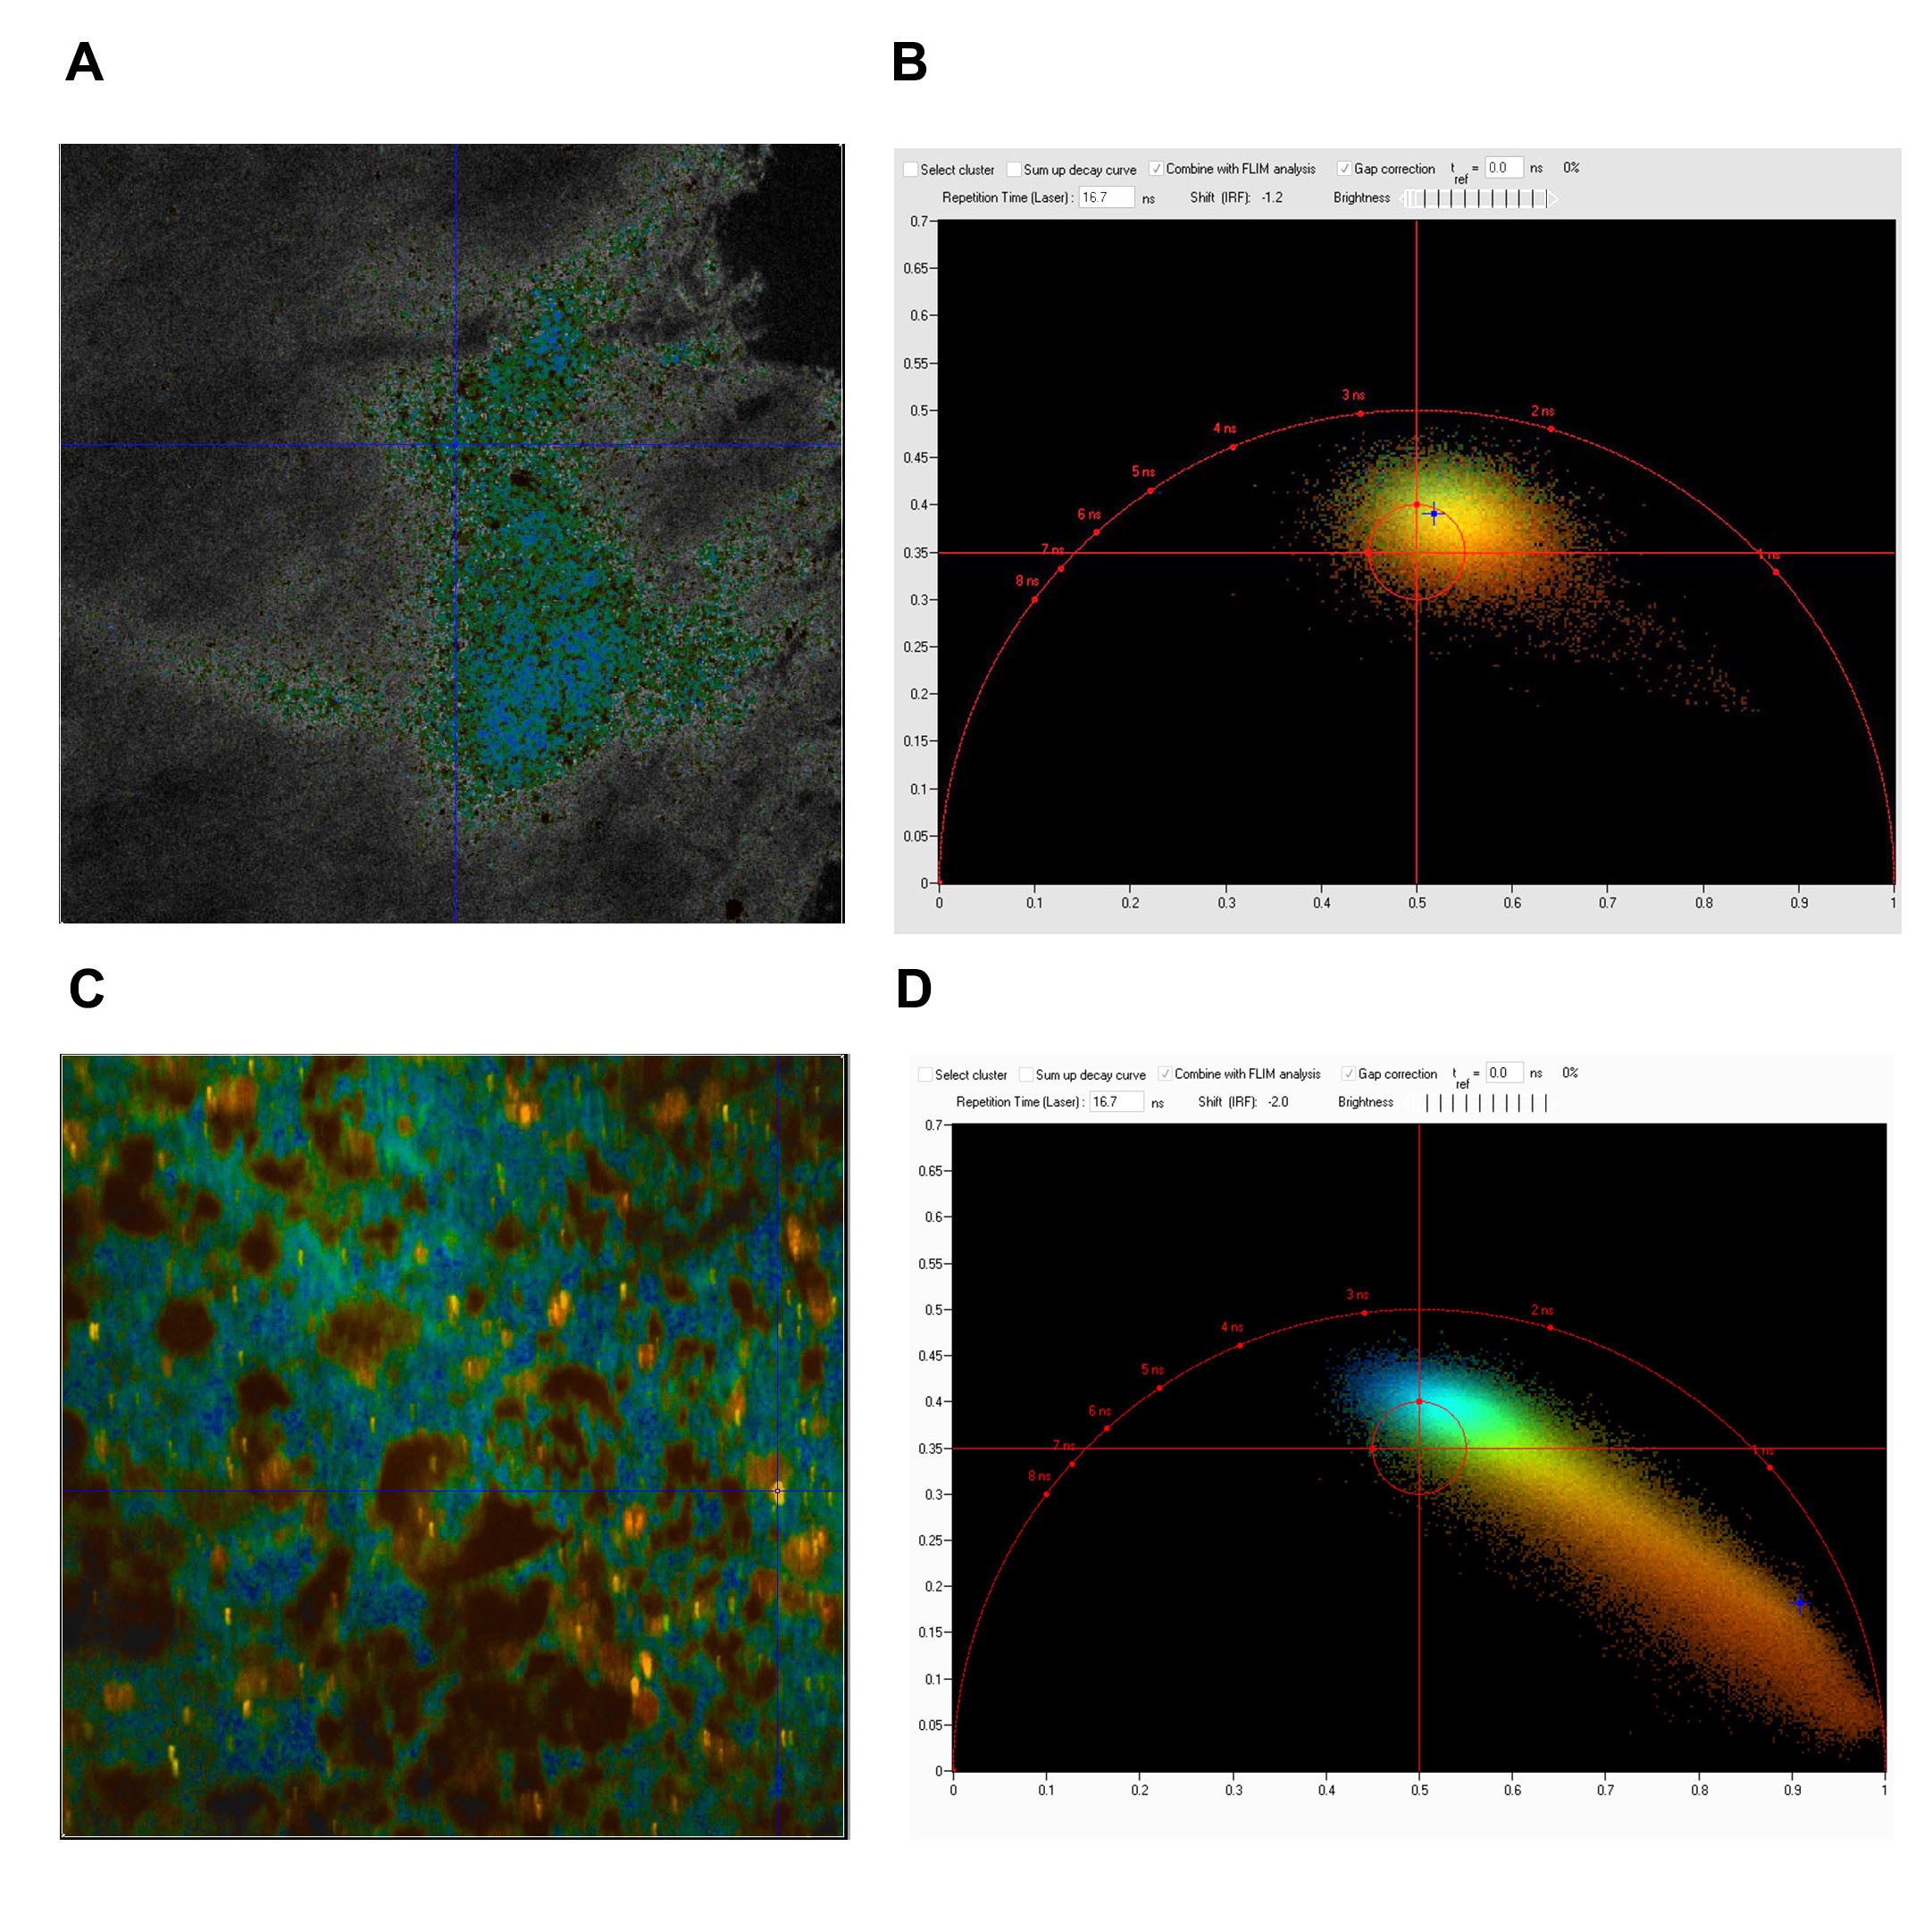
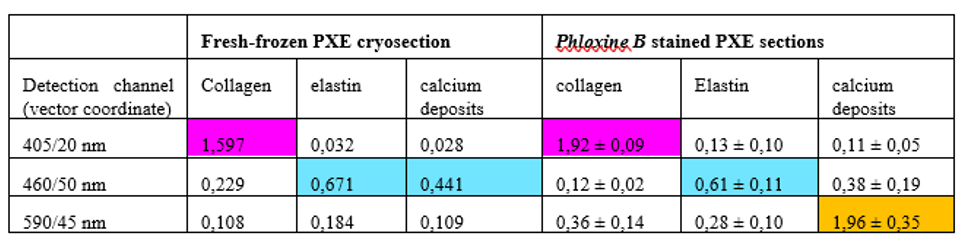
Three-color, stain-free mosaic imaging of Pseudoxanthoma elasticum. — Pseudoxanthoma elasticum is a rare, genetic disease with an autosomal recessive inheritance. PXE is caused by mutations in the ABCC6 gene, which result in decreased serum levels of inorganic pyrophosphate (PPi). As a consequence of low PPi levels, ectopic mineralization and fragmentation of elastic fibers develop in the skin, the endothelium of blood vessels and the Bruch membrane of the eye. PXE is often diagnosed only after severe ophthalmological and cardiovascular complications occur. Multidisciplinary clinical examination, histopathologic evaluation of skin biopsy, in addition to molecular genetic testing is needed for proper diagnosis. Nonlinear microscopy is an innovative non-invasive imaging technology that is increasingly applied in life sciences. Nonlinear processes, such as second-harmonic generation (SHG) or two-photon absorption fluorescence (TPF) generated by ultrafast laser pulses provide stain-free imaging with submicron resolution and higher penetration depth compared to reflectance confocal microscopy. Fibrillar collagen, as being a highly non-centrosymmetric molecule emits strong SHG signal. Elastin fibers and calcium deposits, as endogenous chromophores can be selectively visualized by TPF (see Fig. 3).

S-L2019-3

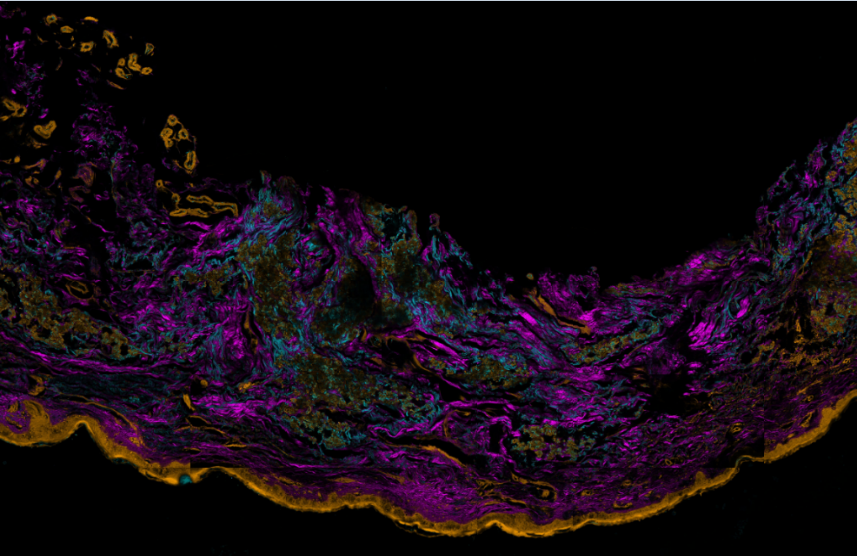
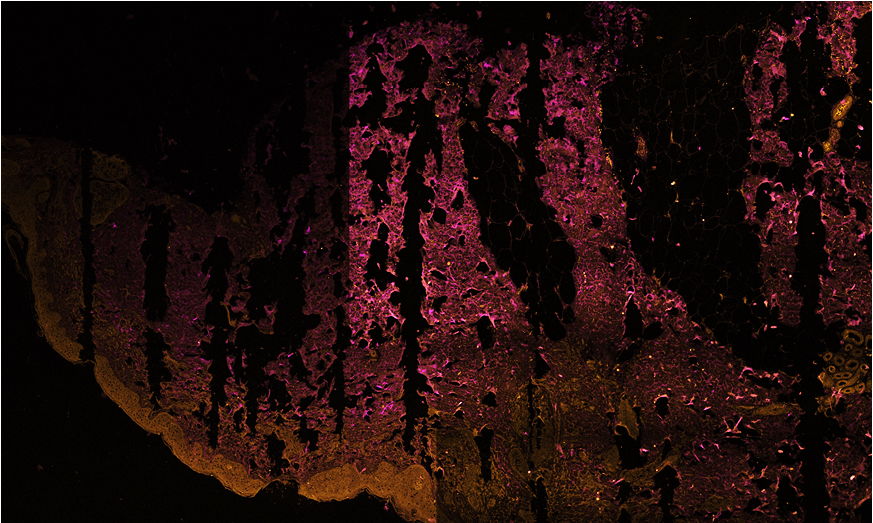
Figure 3. Three color mosaic nonlinear microscope image of a Pseudoxanthoma elasticum skin sample. Collagen, elastin and calcium deposits are respectively visualized in magenta, light blue and yellow colors.

TPF spectra of elastin and calcium deposites overlap considerably, which reduces the chemical contrast in nonlinear microscope imaging. This year we have developed a novel, three-channel detection technique, as well as a numerical image decomposition algorithm for high chemical contrast imaging of collagen, elastin and calcium deposites in PXE samples, the result of which is demonstrated in Figure 3.

Microglia monitor and protect neuronal function via specialized somatic purinergic junctions. — Microglia are the main immune cells in the brain with emerging roles in brain homeostasis and neurological diseases, while mechanisms underlying microglia-neuron communication remain elusive. In a recent experiment, our partners at University Szeged and at the Institute of Experimental Medicine identified a novel site of interaction between neuronal cell bodies and microglial processes in mouse and human brain. Somatic microglia-neuron junctions possess specialized nano-architecture optimized for purinergic signaling. Activity of neuronal mitochondria is linked with microglial junction formation, which is rapidly induced in response to neuronal activation and blocked by inhibition of P2Y12-receptors (P2Y12R). Brain injury-induced changes at somatic junctions trigger P2Y12R-dependent microglial neuroprotection, regulating neuronal calcium load and functional connectivity. Their results suggest that microglial processes at these junctions are in ideal position to monitor and protect neuronal functions in both the healthy and injured brain.

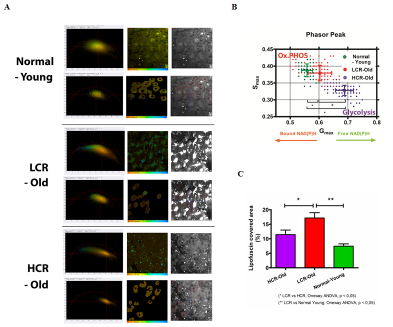
For these real time, stain free two-photon fluorescence imaging experiments performed at University of Szeged, we have developed a laser system comprising two, beam-coupled femtosecond pulse lasers operating at ~750 nm and ~920 nm, respectively. The lasers excited the auto-fluorescence emitted by nicotinamide adenine dinucleotide (NADH) and green fluorescent protein (GFP) simultaneously, which allowed us to record in vivo, time-lapse images of somatic mitochondria in living neurons and microglia, respectively. Representative images of these experiments are shown in Fig. 4. For details, see .

S-L2019-4

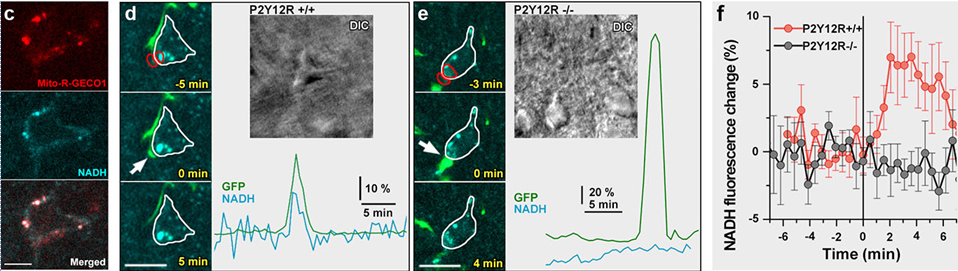
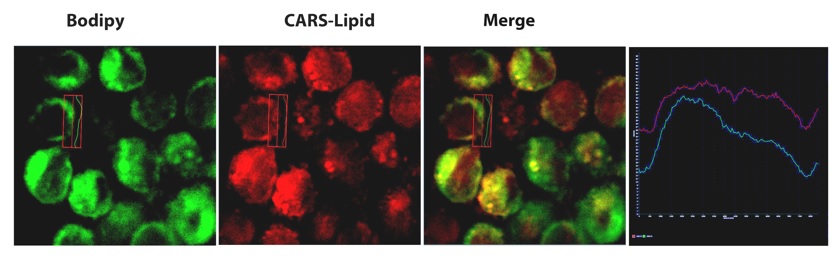
Figure 4. Physiological microglia-neuron communication at the somatic junction site is P2Y12R-dependent and is linked with neuronal mitochondrial activity. a) b) are not shown here. c) Mito-R-Geco1 expression co- nicotinamide adenine dinucleotide (NADH) intrinsic fluorescence. d-e) Representative samples from time-lapse imaging of microglia show processes extend and contact neuronal soma in CX3CR1+/GFP/P2Y12R+/+ (d) and CX3CR1+/GFP/P2Y12R-/- (e) mice. White arrow indicates the contact site of microglia. DIC images of the imaged neurons and the fluorescence signal of GFP (green) and NADH (dark cyan) of red outlined areas are shown. f) Average of NADH intrinsic fluorescence of all neurons in P2Y12R+/+ (red, n=10) and P2Y12R-/- mice (black, n=11).


2018

CARS microscopy; Stain-free histopathology. —Basal cell carcinoma (BCC) is the most common malignancy in Caucasians. Nonlinear microscopy has been previously utilized for the imaging of BCC, but the captured images do not correlate with standard H&E staining. Last year we have developed a novel algorithm to post-process images obtained from dual vibration resonance frequency (DVRF) CARS measurements to acquire high-quality pseudo H&E images of BCC samples. We adapted our CARS setup (for details, see: Haluszka et al. Biomed. Opt. Express 7, 4480–4489, 2016) to utilize the distinct vibrational properties of CH3 (mainly in proteins) and CH2 bonds (primarily in lipids). As a result, we acquired two images: one for “lipids” and one for ”proteins” when we properly set a multiplication factor to minimize the non-specific background. By merging these images, we obtained high contrast H&E “stained” images of BBC’s. Nonlinear microscope systems upgraded for real time DVRF CARS measurements, providing pseudo H&E images can be suitable for in vivo assessment of BCC in the future (for details, see Kiss et al. : Pathology and Oncology Research 24(4), 927-930, 2018). 

This year we introduced a fast and cost efficient spectral modulation technique (IF-CARS) for sub-100 fs pulse Ti-sapphire lasers, which allows us to modulate the laser spectrum on a ms time scale with the use of a piezo-driven Michelson interferometer. Switching between the properly shaped “on-resonance” and “off-resonance” laser spectra can be synchronized either to the electronic “line” or to the “frame” signals of our laser scanning microscope, which allows us to perform real time non-resonant background suppression during CARS imaging. It might have applications in brain research, e.g. when investigating myelin breakdown in murine models with multiple sclerosis (MS) (for details, see Ozsvár et al. Brain Research Bulletin 137, 277-284, 2018). In an alternative setting, we modulate the laser spectrum in such a way, that CARS imaging for “lipids” and “proteins” does not require tuning of our pump laser or readjustment of the time delay, which paves the way for real time stain-free histopathology.

We started from our CARS imaging setup referenced above, which received the Applied Research Prize of Wigner SZFI in 2015. For our IF-CARS experiments, we constructed a small size Michelson interferometer (see Fig.1). In the beam path of the Ti:sapphire laser, we replaced one of the 45 degree folding mirrors by our small size interferometer. One of its mirrors (M2) was placed on a piezo-electric linear actuator. The optical path difference (2*ΔL) had an offset value of ~0.1 mm, which resulted in different modulated laser spectra at the interferometer output depending on the phase difference of the two arms. For our stain-free histopathology imaging experiments on in vitro brain slices, we used different interferometer settings: we switched the phase difference between π/2 and - π/2 at the laser central wavelength of 975 nm. As a result we obtained two wavelength shifted laser spectra with maxima at 793 and 796 nm corresponding to the vibrational resonance of CH3 (mainly in proteins) and CH2 bonds (primarily in lipids).

In the following, we show representative images recorded from in vitro brain slices using this settings.

szr1

Figure 1. A Michelson-interferometer is used for spectral modulation of the pump pulses. Depending on the electronically controlled phase difference of the two arms, different spectra can be generated for CARS imaging. ΔL has a properly set offset value depending on the spectral bandwidth of the laser applied. The phase difference is electronically controlled and synchronized to the frame signal of our microscope.

Myelin sheaths - wrapping around the axons of neurons - are rich in lipid therefore we can record high quality 3D CARS images. Degradation of the myelin sheath is the cause of neurodegenerative diseases, such as multiple sclerosis (MS), but a clear mechanistic understanding of myelin loss is missing. Previously we studied myelin breakdown in murine models with multiple sclerosis (MS) using the toxin cuprizone. We found that myelin debris form lipid droplets alongside myelinated axon fibers. For automatic lipid reconstruction a strong and specific lipid signal is needed. Therefore, to exclude CH3 signal originating primarily from proteins and non-resonant background we introduced spectral modulation with our interferometer. Our results are summarized in Fig. 2.

szr2

Figure 2. IF-CARS imaging of in vitro brain slices with a Mai Tai pump laser tuned to 795 nm. A-B) Images of somatosensory cortex coronal slices of layer 6 and white matter were recorded for two different, spectrally modulated pump pulses with spectral maxima at 793 nm (“CH3”) and 796 nm (“CH2”). C) Subtraction of images (CH2- CH3) highlight more lipid structures. D) Inverse image subtraction (CH3- CH2) reveals protein rich background and somata of neurons. E) Composit image of lipid (red, CH2- CH3) and protein (green, CH3-CH2). Arrows show somata of neurons in layer 6, sidelong lines show the border of layer 6 and the white matter.

Analysis of quantitative parameters in images of the collagen structure of basal cell carcinoma from SHG microscopy. – BCCs often have poorly defined borders, the clinical assessment of the tumor margins can be challenging. Therefore, there is an emerging demand for efficient in vivo imaging techniques for the evaluation of the tumor borders of BCC prior to and during surgeries. This demand might be met in the near future by nonlinear microscope techniques (such as second harmonic generation (SHG) mosaic imaging) utilizing our novel, fibre laser based, hand-held 3D nonlinear microscope system (FiberScope) (for details, see: Krolopp et al. Biomed. Opt. Express 7, 3531–3542, 2016), which received the Applied Research Prize of Wigner SZFI in 2017. This year, we compared various quantitative parameters and algorithms for the analysis of SHG images of collagen in ex vivo human BCC and healthy skin samples to evaluate the utility of these methods in the detection of BCC.

szr3

Figure 3. A-B panels: Power plots of fast Fourier transformed second harmonic generation images. A: basal cell carcinoma (BCC), B: control skin; C: collagen orientation index; D: collagen bundle packing. Error bars represent standard deviation, *p<0.05. 

Among others, we performed Fast Fourier Transformation (FFT) on the SHG images and converted the output of FFT into power plots. We fitted an ellipse to the power plots and collagen orientation index (COI) was calculated by COI = [1-(short axis/long axis)]. A COI value close to 0 reflects a normal sample with isotropic behavior, while a value close to 1 suggests parallel oriented fibers. Collagen bundle packing (CBP) was expressed as CPB = 512*(1/h), where h is the distance between the centers of gravity of two first-order maxima of FFT plots. FFT analysis was performed by ImageJ software (NIH, USA). FFT images of BCC displayed significantly higher COI, indicating that the collagen fibers are less randomly arranged, while no difference was found in the CBP value (Figure 3). In the future, our novel image analysis methods (such us the FFT method briefly introduced here) could be integrated in our handheld nonlinear microscope system for sensitive and specific identification of BCC that, in longer term, can result in different applications such as surgery by robots ((for details, see Kiss et al, Pathology and Oncology Research, DOI 10.1007/s12253-018-0445-1, 2018).

Characterization of DHEA-induced PCOS-model by CARS Microscopy. – Polycystic ovary syndrome (PCOS) is one of most frequent female endocrine disorder, affecting 5%–10% of women, causing infertility, dysfunctional follicular maturation and ovulation, multicystic ovaries, hyperandrogenism. PCOS play a role in the enhancement of the risk of cardiovascular diseases and the development of diabetes. Postnatal treatment of rodents with DHEA (Dehydroepiandrosterone) induced human PCOS characteristics of acyclicity, anovulation, polycystic ovaries, and hyperandrogenism: DHEA induces ovarian cysts and causes abnormal hormon level (increased serum testosterone, androstenedione and 5-α-dihydrotestosterone) similar to the women with PCOS. Development of cysts causes an alteration of ovarian function and an imbalance in the oxidant–antioxidant balance. Increased ROS within ovarian cells is associated with the impaired ovarian function . DHEA transformed into potent estrogens such as estradiol and produces estrogenic effects of female sex hormone. Estradiol is involved in the regulation of the female reproductive cycles and responsible for the development of female secondary sexual characteristics such as the breasts, widening of the hips, and a feminine pattern of fat distribution in women. Mouse cumulus oocyte complexes (COCs) exhibit lipotoxicity responses in association with obesity or following treatment with high levels of lipids in vitro. Traditional medicine, marjoram herb (Origanum majorana) tea was found to improve insulin sensitivity and reduce the levels of adrenal androgens in the hormonal profile of PCOS women in a randomised, double-blind, placebo-controlled trial. Spearmint (Mentha spicata) has treatment potential on PCOS through inhibition of testosterone and restoration of follicular development in ovarian tissue ). In our recent study we investigated the effects of pure 100 % natural essential oil mix of Origanum majorana and Mentha piperita in DHEA-induced PCOS-model by nonlinear microscopy, the results of which are summarized below.

4 week-old (~18 g) female C57 bl/6 mice were kept at 22 ± 2 °C under a 12 h light/12 h darkness cycle. The animals were fed normal diet and water was available ad libidum. C57BL/6 female mice were treated with dehydroepiandrosteron (DHEA) daily (6 mg/100 g body weight in 0,1 ml oil subcutan) for 20 consecutive days. The DHEA treated animals were randomized into different treatment groups (n=6). DHEA-K group and DHEA + Essential oil mix group. The latter group, after a DHEA treatment, was subsequently treated per os for 10 consecutive days with water solution of Origanum majorana (150 mg/kgbody mass, CAS 84082-58-6) and Mentha piperita (20 mg/kgbody mass, CAS 8006-90-4) essential oils. After 20 days DHEA and 10 days Essential oil mix treatment, the mice were injected intraperitoneally (i.p.) with PMSG (pregnant mare’s serum) at 5 IU/12 g of body weight, followed 48 h later by i.p. injection of hCG (human chorionic gonadotropin) at 5 IU/12 g of body weight. The ovaries were dissected and COCs were isolated from the oviducts at 16 h after hCG injection, placed in HEPES-buffered α-MEM (5 % FBS) and counted under microscope. The COCs were stained by Bodipy for lipid content or by MitoSOX Red, which is a mitochondrial superoxide indicator. During the staining procedure manufacturer’s instructions was followed. After washing steps the COCs were fixed by paraformaldehide. We used a 2PEF and CARS imaging setup similar to that was described above. 

As a first step, we checked the co-localization of Bodipy fluorescent labelling and the detected CARS-lipid signal (see Fig.4). We found that even the small lipid droplets in the cells are clearly seen in both pictures. Interestingly, the CARS image shows slightly higher spatial resolution than the 2PEF image. As a next step, we compared the DHEA-induced changes of lipid content and ROS-level in COCs of murine PCOS-model by label-free CARS and MitoSox Red-labelled 2PE fluorescence microscopy (see Fig. 5). We found that DHEA treatment of female mice results in elevated lipid concentration of COCs parallel with increased mitochondrial ROS-production. Essential oil-mix treatment of mice decreased lipid and mitochondrial ROS-level in COCs. According to these results we dare say that CARS imaging might be a plausible approach to examine the effects of drugs on murine PCOS DHEA-model.

szr4

Figure 4. Bodipy staining is concentrated mainly into the cytosol, which shows a clear co-localization with the detected CARS-lipid signal. Interestingly, the CARS image shows slightly higher spatial resolution than the corresponding 2PEF image.

szr5


Figure 5. Comparsion of DHEA-induced changes of lipid content and ROS-level in COCs of murine PCOS-model by label-free CARS and MitoSox Red-labelled 2PE fluorescence microscopy.


2017

Coherent anti-Stokes Raman Spectroscopy (CARS) microscopy; Stain-free histopathology. — Basal cell carcinoma (BCC) is the most common malignancy in Caucasians. Non-linear microscopy has been previously utilized for the imaging of BCC, but the captured images do not correlate with standard hematoxylin and eosin (H&E) staining. This year we have developed a novel algorithm to post-process images obtained from dual vibration resonance frequency (DVRF) CARS measurements to acquire high-quality pseudo H&E images of BCC samples (Fig. 1). We adapted our CARS setup to utilize the distinct vibrational properties of CH3 (mainly in proteins) and CH2 bonds (primarily in lipids). In a narrow-band setup, the central wavelength of the pump laser is set to 791 nm and 796 nm to obtain optimal excitation. Due to the partial overlap of the excitation spectra and the 5-10 nm FWHM spectral bandwidth of our lasers, we set the wavelengths to 790 nm (proteins) and 800 nm (lipids). Non-resonant background from water molecules also reduces the chemical selectivity which can be significantly improved if we subtract the DVRF images from each other. As a result, we acquired two images: one for “lipids” and one for ”proteins” when we properly set a multiplication factor to minimize the non-specific background. By merging these images, we obtained high contrast H&E “stained” images of BBCs. Non-linear microscope systems upgraded for real time DVRF CARS measurements, providing pseudo H&E images can be suitable for in vivo assessment of BCC in the future.

f1

Figure 1. CARS images of mouse epidermis (A-C) and human ba­sal cell carcino­ma (D-F). A, D: “CH2“ images; B, E: “CH3“ images; C, F: merged color DVRF-CARS images (red: CH2-CH3, blue: CH3-CH2). Scale bar: 50 µm.

Multimodal stain-free mosaic imaging of malignant tumour in the skin – BCCs often have poorly defined borders, the clinical assessment of the tumor margins can be challenging. Therefore, there is an emerging demand for efficient in vivo imaging techniques for the evaluation of the tumor borders of BCC prior to and during surgeries. This demand might be met in the near future by non-linear microscopy techniques (such as auto-fluorescence (AF) and second harmonic generation (SHG) mosaic imaging) utilizing our novel, fibre-laser based, hand-held 3D nonlinear microscope system (FiberScope).

f2

Figure 2. Multimodal (AF+SHG) mosaic image of human basal cell carcinoma comprising 6x10 microscope images with an overall area of 2,5x 4.2 mm2. Yellow: detected AF signal, purple: SHG signal of collagen.

This year, we have measured AF and SHG signal of collagen on 10 ex vivo healthy control and BCC skin samples and compared the images by different quantitative image analysis methods. These included integrated optical density (IOD) measurements on AF and SHG images and application of fast Fourier transform (FFT), CT-FIRE and CurveAlign algorithms on SHG images to evaluate collagen structure. In the BCC samples, we found significantly lower IOD of both the AF and SHG signals and higher collagen orientation index utilizing FFT. CT-FIRE algorithm revealed increased collagen fiber length and decreased fiber angle while CurveAlign detected significantly higher fiber alignment of collagen fibers in BCC. These results are in line with previous findings which describe pronounced changes in the collagen structure of BCC. In the future, these novel image analysis methods could be integrated in our FiberScope imaging system for sensitive and specific identification of BCC.

f3

Figure 3. Normal human skin (A, C) and basal cell carcinoma (B, D) collagen SHG images processed by different numerical algorithms. Image size: 420x420 μm2.

Alkalmazott és Nemlineáris Optikai Osztály

Lézeralkalmazások és Optikai Méréstechnika Kutatócsoport
Ultragyors Nanooptika "Lendület" Kutatócsoport
Kristályfizika Kutatócsoport
Femtoszekundumos Lézerek a Nemlineáris 3D Mikroszkópiában Kutatócsoport
Nanoszerkezetek és Alkalmazott Spektroszkópia Kutatócsoport
Munkatársak

További linkek

  • Közérdekű adatok
  • Telefonkönyv
  • Állások
  • Látogatás
  • Impresszum
  • MI nagykövetek
  • Visszaélés bejelentése

User Logined

  • Bejelentkezés

Infrastruktúra

  • Adatközpont
  • Számítógép Hálózati Központ
  • Könyvtár
  • Telephelyi weboldal
  • További infrastruktúrák

Cím

1121 Budapest
Konkoly-Thege Miklós út 29-33.


Kapcsolat

Központi telefon: +36-1-392-2222
Főigazgatói titkárság: +36-1-392- 2512
Sajtókapcsolat: +36-30-487-9869
E-mail: wigner@wigner.hun-ren.hu
facebook logo Kövess minket a Facebookon!
 
youtube logo Youtube csatornánk elérhetősége


Footer

  • Kapcsolat